
Users Guide
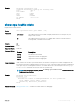


Command Modes
• EXEC
• EXEC Privilege
Supported Modes All Modes
Command History
Version Description
9.9(0.0) Introduced on the FN IOM.
9.4(0.0) Supported on the FN I/O Aggregator.
8.3.17.0 Supported on the M I/O Aggregator.
Usage Information
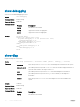
show processes memory output
Field Description
Total: Total system memory available
MaxUsed: Total maximum memory used ever (history indicated with time stamp)
CurrentUsed: Total memory currently in use
CurrentFree: Total system memory available
SharedUsed: Total used shared memory
SharedFree: Total free shared memory
PID Process ID
Process Process Name
ResSize Actual resident size of the process in memory
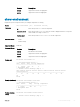
Size Process test, stack, and data size
Allocs Total dynamic memory allocated
Frees Total dynamic memory freed
Max Maximum dynamic memory allocated
Current Current dynamic memory in use
The output for the show process memory command displays the memory usage statistics running on CP part
(sysd) of the system. The sysd is an aggregate task that handles all the tasks running on the M I/O Aggregator’s
CP.
The output of the show memory command and this command dier based on which the Dell Networking OS
processes are counted.
• In the show memory output, the memory size is equal to the size of the application processes.
• In the output of this command, the memory size is equal to the size of the application processes plus the size
of the system processes.
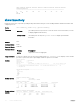
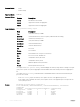
Example
Dell#show processes memory stack-unit 1
Total:2147483648, MaxUsed:499040256, CurrentUsed:499040256, CurrentFree:
1648443392
TaskName TotalAllocated TotalFreed MaxHeld CurrentHolding
f10appioserv 225280 0 0 192512
fcoecntrl 270336 0 0 9277440
f10appioserv 225280 0 0 192512
iscsiOpt 114688 0 0 7380992
dhclient 552960 0 0 1626112
70 Control and Monitoring