
Users Guide

Monitor and Maintain Interfaces
You can display interface statistics with the monitor interface command. This command displays an ongoing list of the interface
status (up/down), number of packets, trac statistics, and so on.
1 View interface statistics. Enter the type of interface and slot/port information:
• For a 10GbE interface, enter the keyword TenGigabitEthernet followed by the slot/port numbers; for example, interface
tengigabitethernet 0/7.
EXEC Privilege mode
monitor interface interface
The information displays in a continuous run, refreshes every two seconds by default(Refer monitor interface command example
below). Use the following keys to manage the output.
• m – Change mode
• c – Clear screen
• l – Page up
• a – Page down
• T – Increase refresh interval (by 1 second)
• t – Decrease refresh interval (by 1 second)
• q – Quit
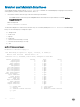
monitor interface command example
Dell#monitor interface tengig 0/1
Dell Networking OS uptime is 1 day(s), 4 hour(s), 31 minute(s)
Monitor time: 00:00:00 Refresh Intvl.: 2s
Interface: Te 0/1, Disabled, Link is Down, Linespeed is 1000 Mbit
Traffic statistics: Current Rate Delta
Input bytes: 0 0 Bps 0
Output bytes: 0 0 Bps 0
Input packets: 0 0 pps 0
Output packets: 0 0 pps 0
64B packets: 0 0 pps 0
Over 64B packets: 0 0 pps 0
Over 127B packets: 0 0 pps 0
Over 255B packets: 0 0 pps 0
Over 511B packets: 0 0 pps 0
Over 1023B packets: 0 0 pps 0
Error statistics:
Input underruns: 0 0 pps 0
Input giants: 0 0 pps 0
Input throttles: 0 0 pps 0
Input CRC: 0 0 pps 0
Input IP checksum: 0 0 pps 0
Input overrun: 0 0 pps 0
Output underruns: 0 0 pps 0
Output throttles: 0 0 pps 0
m - Change mode c - Clear screen
l - Page up a - Page down
T - Increase refresh interval t - Decrease refresh interval
q - Quit
110
Interfaces