
Users Guide


f10appioserv 225280 0 0 192512
l2pm 176128 0 0 24166400
f10appioserv 225280 0 0 192512
arpm 192512 0 0 6955008
f10appioserv 225280 0 0 192512
otm 184320 0 0 7127040
--More--
Dell#
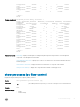
Example (stack-unit)
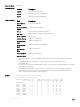
Dell#show process memory stack-unit 1
Total: 2147483648, MaxUsed: 499040256, CurrentUsed: 499040256, CurrentFree:
1648443392
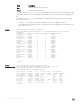
TaskName TotalAllocated TotalFreed MaxHeld CurrentHolding
f10appioserv 225280 0 0 192512
fcoecntrl 270336 0 0 9277440
f10appioserv 225280 0 0 192512
iscsiOpt 114688 0 0 7380992
dhclient 552960 0 0 1626112
f10appioserv 225280 0 0 192512
ndpm 618496 0 0 7389184
f10appioserv 225280 0 0 192512
vrrp 335872 0 0 7712768
f10appioserv 225280 0 0 192512
frrp 180224 0 0 7192576
f10appioserv 225280 0 0 192512
xstp 2740224 0 0 9445376
f10appioserv 225280 0 0 192512
pim 1007616 0 0 7585792
f10appioserv 225280 0 0 192512
igmp 417792 0 0 14774272
f10appioserv 225280 0 0 192512
mrtm 5496832 0 0 12636160
--More--
Dell#
Related Commands
show diag— displays the data plane or management plane input and output statistics of the designated
component of the designated stack member.
show hardware system-ow— displays Layer 3 ACL or QoS data for the selected stack member and stack
member port-pipe.
show interfaces stack-unit— displays information on all interfaces on a specic stack member.
show processes memory— displays CPU usage information based on running processes.
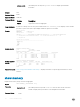
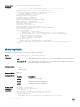
show processes ipc ow-control
Displays the single window protocol queue (SWPQ) statistics.
Syntax
show processes ipc flow-control [cp]
Parameters
cp (OPTIONAL) Enter the keyword cp to view the control processor’s SWPQ statistics.
Defaults none
Command Modes
• EXEC
• EXEC Privilege
Control and Monitoring 65