
Users Guide
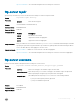


show cpu-trac-stats
Display the CPU trac statistics.
Syntax
show cpu-traffic-stats [port number | all]
Parameters
port number (OPTIONAL) Enter the port number to display trac statistics on that port only. The
range is from 1 to 1568.
all (OPTIONAL) Enter the keyword all to display trac statistics on all the interfaces
receiving trac, sorted based on the trac.
Defaults all
Command Modes EXEC
Supported Modes All Modes
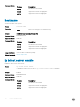
Command History
Version Description
9.9(0.0) Introduced on the FN IOM.
9.4(0.0) Supported on the FN I/O Aggregator.
8.3.17.0 Supported on the M I/O Aggregator.
Usage Information Trac statistics are sorted on a per-interface basis; the interface receiving the most trac is displayed rst. All
CPU and port information is displayed unless a specic port or CPU is specied. Trac information is displayed for
router ports only; not for management interfaces. The trac statistics are collected only after the debug cpu-
traffic-stats command is executed; not from the system bootup.
NOTE: After debugging is complete, use the no debug cpu-traffic-stats command to shut o
trac statistics collection.
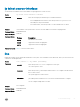
Example
Dell#show cpu-traffic-stats
Processor : CP
--------------
Received 100% traffic on TenGigabitEthernet 8/2 Total packets:100
LLC:0, SNAP:0, IP:100, ARP:0, other:0
Unicast:100, Multicast:0, Broadcast:0
Dell#
Related Commands debug cpu-trac-stats — enables CPU trac statistics for debugging.
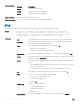
show debugging
View a list of all enabled debugging processes.
Syntax
show debugging
Command Modes EXEC Privilege
Supported Modes All Modes
Command History
Version Description
9.9(0.0) Introduced on the FN IOM.
9.4(0.0) Supported on the FN I/O Aggregator.
Control and Monitoring 59