
Reference Guide


Control and Monitoring | 53
Usage
Information
Traffic statistics are sorted on a per-interface basis; the interface receiving the most traffic is displayed
first. All CPU and port information is displayed unless a specific port or CPU is specified. Traffic
information is displayed for router ports only; not for management interfaces. The traffic statistics are
collected only after the debug cpu-traffic-stats command is executed; not from the system bootup.
Related
Commands
show debugging
Displays a list of all enabled debugging processes.
Syntax
show debugging
Command Mode
EXEC Privilege
Command
History
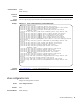
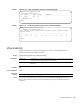
Example
Figure 5-8. show debugging Command Example
show diag
Displays the diagnostics information.
Syntax
show diag {information | stack-unit number [detail | summary]] | testcase}
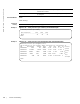
Parameters
Note: After debugging is complete, use the no debug cpu-traffic-stats command to shut off
traffic statistics collection.
debug cpu-traffic-stats Enables CPU traffic statistics for debugging.
Version 8.3.17.0 Supported on M I/O Aggregator
FTOS#show debug
Generic IP: (Access List: test)
IP packet debugging is on for (Access List: test)
TenGigabitEthernet 0/16
ICMP packet debugging is on for
TenGigabitEthernet 0/16
OSPF:1
OSPF packet debugging is on
DHCP:
DHCP debugging is on
FTOS#
information Enter the keyword information to view current diagnostics information
in the system.
stack-unit unit-id (OPTIONAL) Enter the keyword stack-unit followed by the unit-id to display
information on a specific stack member. Range: 0 to 5.
detail
(OPTIONAL) Enter the keyword detail to view detailed diagnostics
information.