
Users Guide
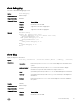


Field Description
Process Process Name
ResSize Actual resident size of the process in memory
Size Process test, stack, and data size
Allocs Total dynamic memory allocated
Frees Total dynamic memory freed
Max Maximum dynamic memory allocated
Current Current dynamic memory in use
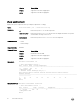
The output for the show process memory command displays the memory usage statistics running on
CP part (sysd) of the system. The sysd is an aggregate task that handles all the tasks running on the M I/O
Aggregator’s CP.
The output of the show memory command and this command dier based on which the Dell Networking
OS processes are counted.
• In the show memory output, the memory size is equal to the size of the application processes.
• In the output of this command, the memory size is equal to the size of the application processes plus the
size of the system processes.
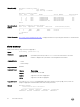
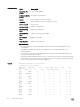
Example
Dell#show processes memory stack-unit 1
Total: 2147483648, MaxUsed: 499040256, CurrentUsed: 499040256,
CurrentFree:
1648443392
TaskName TotalAllocated TotalFreed MaxHeld
CurrentHolding
f10appioserv 225280 0 0 192512
fcoecntrl 270336 0 0 9277440
f10appioserv 225280 0 0 192512
iscsiOpt 114688 0 0 7380992
dhclient 552960 0 0 1626112
f10appioserv 225280 0 0 192512
ndpm 618496 0 0 7389184
f10appioserv 225280 0 0 192512
vrrp 335872 0 0 7712768
f10appioserv 225280 0 0 192512
frrp 180224 0 0 7192576
f10appioserv 225280 0 0 192512
xstp 2740224 0 0 9445376
f10appioserv 225280 0 0 192512
pim 1007616 0 0 7585792
f10appioserv 225280 0 0 192512
igmp 417792 0 0 14774272
f10appioserv 225280 0 0 192512
mrtm 5496832 0 0 12636160
--More--
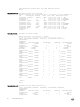
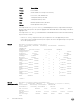
Example
(management-unit)
Dell#show processes memory management-unit
Total : 2147483648, MaxUsed : 499093504 [07/23/2012 17:42:16]
CurrentUsed: 499093504, CurrentFree: 1648390144
SharedUsed : 18470440, SharedFree : 2501104
PID Process ResSize Size Allocs Frees Max
Current
633 fcoecntrl 9277440 270336 1380528 132512 1281144
1248016
289 iscsiOpt 7380992 114688 23262 16564 23262
6698
70
Control and Monitoring