
Users Guide
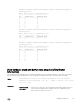


Dell#show hardware buffer-stats-snapshot resource interface fortyGigE 1/1
priority-group all
Unit 1 unit: 0 port: 1 (interface Fo 1/1)
---------------------------------------
PG# SHARED CELLS HEADROOM CELLS
---------------------------------------
0 0 0
1 0 0
2 0 0
3 0 0
4 0 0
5 0 0
6 0 0
7 0 0
Dell#show hardware buffer-stats-snapshot resource interface fortyGigE 0/0
priority-group 7
Unit 0 unit: 0 port: 1 (interface Fo 0/0)
---------------------------------------
PG# SHARED CELLS HEADROOM CELLS
---------------------------------------
7 0 0
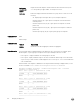
Dell#show hardware buffer-stats-snapshot resource interface fortyGigE 0/0
priority-group all
Unit 0 unit: 0 port: 1 (interface Fo 0/0)
---------------------------------------
PG# SHARED CELLS HEADROOM CELLS
---------------------------------------
0 0 0
1 0 0
2 0 0
3 0 0
4 0 0
5 0 0
6 0 0
7 0 0
show hardware stack-unit buer-stats-snapshot (Total Buer
Information)
View the buer statistics tracking resource information depending on the type of buer information, such as device-level details,
port-level counters, queue-based snapshots, or priority group-level snapshot in the egress and ingress direction of trac.
Syntax
show hardware stack-unit {id} buffer-stats-snapshot unit {id} resource
interface all {priority-group { id | all } | queue { ucast{id | all}{ mcast
{id | all} | all}
Parameters
stack-unit stack-
unit-number
Unique ID of the stack unit to select a particular stack member and then enter one
of the following command options to display a collection of data based on the
option entered. The range is from 0 to 11.
Debugging and Diagnostics
421