
Users Guide
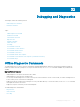
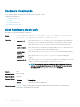
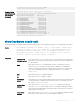
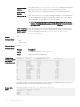
Table Of Contents
- Dell PowerEdge Command Line Reference Guide for the M I/O Aggregator 9.14.0.0
- About this Guide
- Before You Start
- CLI Basics
- File Management
- Control and Monitoring
- asset-tag
- clear alarms
- clear command history
- configure
- debug cpu-traffic-stats
- debug ifm trace-flags
- disable
- enable
- end
- exit
- feature unique-name
- ftp-server enable
- ftp-server topdir
- ftp-server username
- hostname
- http-server
- ip telnet server enable
- ip telnet source-interface
- line
- ping
- reload
- service timestamps
- show alarms
- show command-history
- show configuration lock
- show cpu-traffic-stats
- show debugging
- show diag
- show environment
- show inventory
- show memory
- show processes cpu
- show processes ipc flow-control
- show processes memory
- show reset-reason
- show revision
- show server-interfaces
- show system
- show tech-support
- show uplink brief
- show util-threshold cpu
- show util-threshold memory
- ssh-peer-stack-unit
- telnet
- telnet-peer-stack-unit
- terminal length
- terminal monitor
- terminal xml
- trace route
- undebug all
- write
- u-Boot
- boot change
- boot selection
- boot show net config retries
- boot write net config retries
- boot zero
- default gateway
- enable
- help
- ignore enable password
- ignore startup-config
- interface management ethernet ip address
- no default gateway
- no interface management ethernet ip address
- reload
- show boot blc
- show boot selection
- show bootflash
- show bootvar
- show default gateway
- show interface management ethernet
- show interface management port config
- syntax help
- Configuration Cloning
- Data Center Bridging (DCB)
- Fibre Channel over Ethernet for FC Flex IO Modules
- advertise dcbx-appln-tlv
- advertise dcbx-tlv
- bandwidth-percentage
- clear dcbx counters
- clear ets counters
- clear pfc counters
- dcb-enable
- dcb enable pfc-queues
- dcb enable auto-detect on-next-reload
- dcb-map stack-unit all stack-ports all
- dcb pfc-shared-buffer-size
- dcb pfc-total-buffer-size
- dcb-buffer-threshold
- dcb-policy buffer-threshold (Global Configuration)
- service-class buffer shared-threshold-weight
- dcbx-port role
- dcbx version
- debug dcbx
- fc-map
- fcoe-map
- fcoe priority-bits
- iscsi priority-bits
- keepalive
- interface vlan (NPIV proxy gateway)
- pfc mode on
- pfc no-drop queues
- pfc priority
- priority-group
- priority-group bandwidth pfc
- priority-pgid
- qos-policy-output ets
- scheduler
- show dcb
- show interface dcbx detail
- show interface ets
- show interface pfc
- show interface pfc statistics
- show qos dcb-map
- show stack-unit stack-ports ets details
- show stack-unit stack-ports pfc details
- Dynamic Host Configuration Protocol
- FC Flex IO Modules
- FC FLEXIO FPORT
- FIP Snooping
- Internet Group Management Protocol (IGMP)
- IGMP Commands
- IGMP Snooping Commands
- clear ip igmp groups
- debug ip igmp
- ip igmp group-join-limit
- ip igmp querier-timeout
- ip igmp query-interval
- ip igmp query-max-resp-time
- ip igmp snooping enable
- ip igmp snooping fast-leave
- ip igmp snooping flood
- ip igmp snooping last-member-query-interval
- ip igmp snooping mrouter
- ip igmp snooping querier
- ip igmp version
- show ip igmp groups
- show ip igmp interface
- show ip igmp snooping mrouter
- Interfaces
- Port Interface Commands
- Port Channel Commands
- Time Domain Reflectometer (TDR) Commands
- Virtual LAN (VLAN) Commands
- auto vlan
- channel-member
- clear counters
- clear mac-address-table dynamic
- default vlan-id
- description
- feature fc
- flowcontrol
- interface
- interface ManagementEthernet
- interface port-channel
- interface range
- interface vlan
- intf-type cr4 autoneg
- keepalive
- minimum-links
- monitor interface
- mtu
- name
- negotiation auto
- remote-fault-signaling rx
- show config (INTERFACE mode)
- show config (from INTERFACE RANGE mode)
- show config (from INTERFACE VLAN mode)
- show config (from PROTOCOL LLDP mode)
- show interfaces
- show interfaces configured
- show interfaces description
- show interfaces port-channel
- show interfaces stack-unit
- show interfaces status
- show interfaces switchport
- show tdr
- show vlan
- shutdown
- source (port monitoring for 40-Gigabit Ethernet)
- speed (for 1000/10000 interfaces)
- stack-unit portmode
- wavelength
- tdr-cable-test
- vlan tagged (CMC)
- vlan untagged (CMC)
- IPv4 Routing
- iSCSI Optimization
- Isolated Networks
- Link Aggregation Control Protocol (LACP)
- auto-lag enable
- clear lacp counters
- debug lacp
- delay-restore abort-threshold
- io-aggregator auto-lag enable
- lacp link-fallback
- lacp long-timeout
- lacp port-priority
- port-channel mode
- port-channel-protocol lacp
- show interfaces port-channel
- show io-aggregator auto-lag status
- show lacp
- show link-bundle-distribution port-channel
- show port-channel-flow
- Layer 2
- Link Layer Discovery Protocol (LLDP)
- Object Tracking
- Port Monitoring
- Quality of Service (QoS)
- Per-Port QoS Commands
- Policy-Based QoS Commands
- bandwidth-percentage
- description
- dot1p-priority
- policy-aggregate
- policy-map-output
- qos-policy-output
- rate-shape
- service-class bandwidth-percentage
- service-class dot1p-mapping
- service-class dynamic dot1p
- service-policy output
- service-queue
- show qos dcb-map
- show qos dot1p-queue-mapping
- show qos qos-policy-output
- Security
- Simple Network Management Protocol (SNMP) and Syslog
- Stacking Commands
- Storm Control
- SupportAssist
- System Time
- Uplink Failure Detection (UFD)
- Virtual Link Trunking (VLT)
- Debugging and Diagnostics
- Offline Diagnostic Commands
- Hardware Commands
- clear hardware stack-unit
- diag stack-unit
- hardware watchdog
- offline stack-unit
- show diag
- show hardware stack-unit
- show hardware counters interface
- show hardware buffer interface
- show hardware system-flow
- show hardware buffer-stats-snapshot
- show hardware stack-unit buffer-stats-snapshot (Total Buffer Information)
- show hardware drops
- Internet Control Message Protocol (ICMP) Message Types

************************************* END
**************************************
Example 4 (show
diag testcase stack-
unit interactive
Command)
Dell#show diag testcase stack-unit 0 interactive
**************************** Navasota Diagnostics Test
*************************
Test ID Test Description Test Level
------- ---------------- ----------
401 POWERLEDTEST Interactive
402 DEBUGLEDTEST Interactive
403 STATUSLEDTEST Interactive
404 OPTMODLEDCONTROLTEST Interactive
405 FIXEDLEDCONTROLTEST Interactive
406 RTCBATTERYTEST Interactive
407 CPLDRESETTEST Interactive
408 I2CDEVICESCANTEST Interactive
409 SERVERPORTPHYEXTLINKTEST Interactive
410 CPUSNAKEQSFPPEXTLPBKTEST Interactive
411 CPUSNAKEOPTMODEXTLPBKTEST Interactive
Total Diagnostic Testcases in Interactive: 11
************************************* END
**************************************
show hardware stack-unit
Display the data plane or management plane input and output statistics of the designated component of the designated stack member.
Syntax
show hardware stack-unit 0-5 {buffer [ unit 0 ] total buffer | buffer unit 0
interface all queue [(0-14) | a11] buffer-info} {phy-firmware-version} {cpu
data-plane statistics [stack-port 0-52] | cpu party-bus statistics | cpu
private-mgmt statistics | drops [unit 0-1 ] | stack-port 33-56 | unit 0-0
{counters | details | port-stats [detail] | register}}
Parameters
stack-unit 0–5
{command-option}
Enter the keywords stack-unit then 0 to 5 to select a particular stack member and
then enter one of the following command options to display a collection of data based on
the option entered.
buer Enter the keyword buffer. To display buer statistics for a all interface, enter the
keyword interface followed by the keyword all. To display the forwarding plane
statistics containing the packet buer usage per port per stack unit, enter the keyword
unit then 0 for port-pipe 0, then port and the port number (42-53, and then
buffer-info.
fpga Enter the keyword fpga, to display fpga details.
fru Enter the keyword fru, to display fru details.
phy-rmware-
version
Each member of the stack is updated automatically with the latest rmware while booting
as well as during OIR. To dump the physical rmware version for stack units, enter the
keywords phy-firmware-version.
cpu data-plane
statistics
Enter the keywords cpu data-plane statistics , optionally followed by the
keywords stack port and its number from 0 to 52 to display the data plane statistics,
which shows the High Gig (Higig) port raw input/output counter statistics to which the
stacking module is connected.
cpu party-bus
statistics
Enter the keywords cpu party-bus statistics, to display the Management plane
input/output counter statistics of the Private Management interface.
Debugging and Diagnostics 439