
Deployment Guide

************************************* END
**************************************
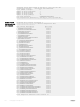
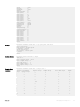
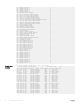
Example 4 (show
diag testcase stack-
unit interactive
Command)
Dell#show diag testcase stack-unit 0 interactive
**************************** Navasota Diagnostics Test
*************************
Test ID Test Description Test Level
------- ---------------- ----------
401 POWERLEDTEST Interactive
402 DEBUGLEDTEST Interactive
403 STATUSLEDTEST Interactive
404 OPTMODLEDCONTROLTEST Interactive
405 FIXEDLEDCONTROLTEST Interactive
406 RTCBATTERYTEST Interactive
407 CPLDRESETTEST Interactive
408 I2CDEVICESCANTEST Interactive
409 SERVERPORTPHYEXTLINKTEST Interactive
410 CPUSNAKEQSFPPEXTLPBKTEST Interactive
411 CPUSNAKEOPTMODEXTLPBKTEST Interactive
Total Diagnostic Testcases in Interactive: 11
************************************* END
**************************************
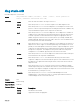
show hardware stack-unit
Display the data plane or management plane input and output statistics of the designated component of the designated stack member.
Syntax
show hardware stack-unit 0-5 {buffer [ unit 0 ] total buffer | buffer unit 0
interface all queue [(0-14) | a11] buffer-info} {phy-firmware-version} {cpu
data-plane statistics [stack-port 0-52] | cpu party-bus statistics | cpu
private-mgmt statistics | drops [unit 0-1 ] | stack-port 33-56 | unit 0-0
{counters | details | port-stats [detail] | register}}
Parameters
stack-unit 0–5
{command-option}
Enter the keywords stack-unit then 0 to 5 to select a particular stack member and
then enter one of the following command options to display a collection of data based on
the option entered.
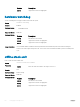
buer Enter the keyword buffer. To display buer statistics for a all interface, enter the
keyword interface followed by the keyword all. To display the forwarding plane
statistics containing the packet buer usage per port per stack unit, enter the keyword
unit then 0 for port-pipe 0, then port and the port number (42-53, and then
buffer-info.
fpga Enter the keyword fpga, to display fpga details.
fru Enter the keyword fru, to display fru details.
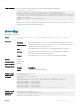
phy-rmware-
version
Each member of the stack is updated automatically with the latest rmware while booting
as well as during OIR. To dump the physical rmware version for stack units, enter the
keywords phy-firmware-version.
cpu data-plane
statistics
Enter the keywords cpu data-plane statistics , optionally followed by the
keywords stack port and its number from 0 to 52 to display the data plane statistics,
which shows the High Gig (Higig) port raw input/output counter statistics to which the
stacking module is connected.
cpu party-bus
statistics
Enter the keywords cpu party-bus statistics, to display the Management plane
input/output counter statistics of the Private Management interface.
Debugging and Diagnostics 435