
Users Guide


> System/Server Module, the major categories of system/server module components that may appear are Main System Chassis/
Main System, Software, and Storage.
To expand a branch of the tree, click the plus sign ( ) to the left of an object, or double-click the object. A minus sign ( ) indicates an
expanded entry that cannot be expanded further.
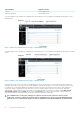
Action Window
When you click an item on the system tree, details about the component or object appear in the data area of the action window. Clicking
an action tab displays all available user options as a list of subcategories.
Clicking an object on the system/server module tree opens that component's action window, displaying the available action tabs. The data
area defaults to a preselected subcategory of the first action tab for the selected object.
The preselected subcategory is usually the first option. For example, clicking the Main System Chassis/Main System object opens an
action window in which the
Properties action tab and Health subcategory are displayed in the window's data area.
Data Area
The data area is located below the action tabs on the right side of the home page. The data area is where you perform tasks or view
details about system components. The content of the window depends on the system tree object and action tab that is currently selected.
For example, when you select BIOS from the system tree, the Properties tab is selected by default and the version information for the
system BIOS appears in the data area. The data area of the action window contains many common features, including status indicators,
task buttons, underlined items, and gauge indicators.
The Server Administrator user interface displays the date in the <mm/dd/yyyy> format.
System or Server module component status indicators
The icons that appear next to component names show the status of that component (as of the latest page refresh).
Table 9. System or Server Module Component Status Indicators
Description Icon
The component is healthy (normal).
The component has a warning (noncritical) condition. A warning condition occurs when a probe or other monitoring
tool detects a reading for a component that falls within certain minimum and maximum values. A warning condition
requires prompt attention.
The component has a failed or critical condition. A critical condition occurs when a probe or other monitoring tool
detects a reading for a component that falls within certain minimum and maximum values. A critical condition
requires immediate attention.
The component's health status is unknown.
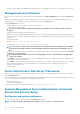
Task Buttons
Most windows opened from the Server Administrator home page contain at least five task buttons: Print, Export, Email, Help and
Refresh. Other task buttons are included on specific Server Administrator windows. The Log window, for example, also contain Save As
and Clear Log task buttons.
• Clicking Print ( ) prints a copy of the open window to your default printer.
• Clicking Export ( ) generates a text file that lists the values for each data field on the open window. The export file is saved to a
location you specify. For information about customizing the delimiter separating the data field values see, "Setting User"and "System
Preferences."
• Clicking E-mail ( ) creates an e-mail message addressed to your designated email recipient. For instructions on setting up your
email server and default email recipient, see "Setting User"and "System Preferences."
28
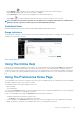
Using Server Administrator