
Users Guide
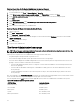
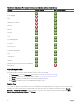
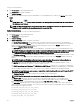
Table Of Contents
- Dell EMC OpenManage Server Administrator Version 9.0.1 User's Guide
- Introduction
- Installation
- Updating individual system components
- Storage Management Service
- Instrumentation Service
- Remote Access Controller
- Logs
- What is new in this release
- Systems management standards availability
- Server Administrator Home Page
- Other Documents You May Need
- Obtaining Technical Assistance
- Contacting Dell EMC
- Setup And Administration
- Role-Based Access Control
- Authentication
- Encryption
- Assigning User Privileges
- Adding users to a domain on Windows operating systems
- Creating Server Administrator users for supported Red Hat Enterprise Linux and SUSE Linux Enterprise Server operating systems
- Disabling Guest And Anonymous Accounts In Supported Windows Operating Systems
- Configuring The SNMP Agent
- Firewall Configuration On Systems Running Supported Red Hat Enterprise Linux Operating Systems And SUSE Linux Enterprise Server
- Using Server Administrator
- Logging In And Out
- Server Administrator Local System Login
- Server Administrator Managed System Login — Using the Desktop Icon
- Server Administrator Managed System Login — Using The Web Browser
- Central web server login
- Using The Active Directory Login
- Single Sign-On
- Configuring Security Settings On Systems Running A Supported Microsoft Windows Operating System
- The Server Administrator home page
- Using The Online Help
- Using The Preferences Home Page
- Using The Server Administrator Command Line Interface
- Logging In And Out
- Server Administrator services
- Working with remote access controller
- Viewing Basic Information
- Configuring The Remote Access Device To Use A LAN Connection
- Configuring The Remote Access Device To Use A Serial Port Connection
- Configuring The Remote Access Device To Use A Serial Over LAN Connection
- Additional Configuration For iDRAC
- Configuring Remote Access Device Users
- Setting Platform Event Filter Alerts
- Server Administrator logs
- Setting Alert Actions
- Troubleshooting
- Frequently Asked Questions
To expand a branch of the tree, click the plus sign ( ) to the left of an object, or double-click the object. A minus sign ( )
indicates an expanded entry that cannot be expanded further.
Action Window
When you click an item on the system tree, details about the component or object appear in the data area of the action window.
Clicking an action tab displays all available user options as a list of subcategories.
Clicking an object on the system/server module tree opens that component's action window, displaying the available action tabs. The
data area defaults to a preselected subcategory of the rst action tab for the selected object.
The preselected subcategory is usually the rst option. For example, clicking the Main System Chassis/Main System object opens
an action window in which the Properties action tab and Health subcategory are displayed in the window's data area.
Data Area
The data area is located below the action tabs on the right side of the home page. The data area is where you perform tasks or view
details about system components. The content of the window depends on the system tree object and action tab that is currently
selected. For example, when you select BIOS from the system tree, the Properties tab is selected by default and the version
information for the system BIOS appears in the data area. The data area of the action window contains many common features,
including status indicators, task buttons, underlined items, and gauge indicators.
The Server Administrator user interface displays the date in the <mm/dd/yyyy> format.
System/Server module component status indicators
The icons that appear next to component names show the status of that component (as of the latest page refresh).
Table 9. System/Server Module Component Status Indicators
Description Icon
The component is healthy (normal).
The component has a warning (noncritical) condition. A warning condition occurs when a probe or other
monitoring tool detects a reading for a component that falls within certain minimum and maximum values. A
warning condition requires prompt attention.
The component has a failed or critical condition. A critical condition occurs when a probe or other monitoring
tool detects a reading for a component that falls within certain minimum and maximum values. A critical
condition requires immediate attention.
The component's health status is unknown.
Task Buttons
Most windows opened from the Server Administrator home page contain at least ve task buttons: Print, Export, Email, Help and
Refresh. Other task buttons are included on specic Server Administrator windows. The Log window, for example, also contain Save
As and Clear Log task buttons.
• Clicking Print ( ) prints a copy of the open window to your default printer.
• Clicking Export ( ) generates a text le that lists the values for each data eld on the open window. The export le is
saved to a location you specify. For information about customizing the delimiter separating the data eld values see, "Setting
User"and "System Preferences."
• Clicking E-mail ( ) creates an e-mail message addressed to your designated email recipient. For instructions on setting up
your email server and default email recipient, see "Setting User"and "System Preferences."
• Clicking Refresh ( ) reloads the system component status information in the action window data area.
27