Dell™ OpenManage™ Server Administrator Messages Reference Guide w w w. d e l l . c o m | s u p p o r t . d e l l .
Notes and Cautions NOTE: A NOTE indicates important information that helps you make better use of your computer. CAUTION: A CAUTION indicates potential damage to hardware or loss of data if instructions are not followed. ____________________ Information in this document is subject to change without notice. © 2009 Dell Inc. All rights reserved. Reproduction of these materials in any manner whatsoever without the written permission of Dell Inc. is strictly forbidden.
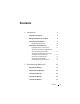
Contents 1 Introduction . . . . . . . . . . . . . . . . . . . . . . . . What’s New in this Release . . . . . . . . . . . . . . . . Messages Not Described in This Guide Understanding Event Messages Sample Event Message Text 8 . . . . . . . . . . . . . 8 . . . . . . . . . . . . . . . . . . . . . . Logging Messages to a Unicode File . . . . . . . Viewing Events in Windows 2000 Advanced Server and Windows Server 2003 . . . . . .
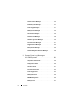
Chassis Intrusion Messages . . . . . . . . . . . . . . 35 Redundancy Unit Messages . . . . . . . . . . . . . . . 37 . . . . . . . . . . . . . . . . 41 Power Supply Messages Memory Device Messages Fan Enclosure Messages . . . . . . . . . . . . . . . 45 . . . . . . . . . . . . . . . . 46 AC Power Cord Messages . . . . . . . . . . . . . . . . Hardware Log Sensor Messages . . . . . . . . . . . . 49 Processor Sensor Messages . . . . . . . . . . . . . . 51 Pluggable Device Messages . . . .
Hardware Log Sensor Events Drive Events . . . . . . . . . . . . . . 68 . . . . . . . . . . . . . . . . . . . . . . . 69 Intrusion Events BIOS Generated System Events . . . . . . . . . . . . . 72 . . . . . . . . . . . . . . 78 . . . . . . . . . . . . . . . 79 . . . . . . . . . . . . . . . . . . . . . . 79 R2 Generated System Events Cable Interconnect Events Battery Events Power And Performance Events Entity Presence Events 4 . . . . . . . . . . . . 80 . . . . . . . . . . . . . . . . .
Contents
Introduction Dell™ OpenManage™ Server Administrator produces event messages stored primarily in the operating system or Server Administrator event logs. This document describes the event messages created by Server Administrator version 6.0.3 and displayed in the Server Administrator Alert log. Server Administrator creates events in response to sensor status changes and other monitored parameters.
• No SNMP trap support for this release. • No support for LRA numbers for this release. • Added two new alerts 1013 and 2382 in the “Miscellaneous Messages” and “Alert Descriptions and Corrective Actions” sections respectively. • Added the POST Code Errors table in the “BIOS Generated System Events” section. • Support for Solid State Drives (SSD). Added new SSD alert 2370 in the “Storage Management Message Reference” section.
Table 1-1. Icon Understanding Event Messages Alert Severity Component Status OK /Normal / Informational An event that describes the successful operation of a unit. The alert is provided for informational purposes and does not indicate an error condition. For example, the alert may indicate the normal start or stop of an operation, such as power supply or a sensor reading returning to normal.
• Redundancy Unit Sensor — Monitors redundant units (critical units such as fans, AC power cords, or power supplies) within the chassis; also monitors the chassis and any attached systems. For example, redundancy allows a second or nth fan to keep the chassis components at a safe temperature when another fan has failed. Redundancy is normal when the intended number of critical components are operating. Redundancy is degraded when a component fails, but others are still operating.
Date and Time: Mon Oct 21 10:38:00 2002 Computer: Description: Server Administrator starting Data: Bytes in Hex Viewing Alerts and Event Messages NOTE: The Red Hat® Enterprise Linux®, SUSE® Linux Enterprise Server and Microsoft® Windows® content mentioned in the following section do not apply to the VMware® ESXi version 3.5 Update 4 release. An event log is used to record information about important events.
Logging Messages to a Unicode File Logging messages to a Unicode text file is optional. By default, the feature is disabled. To enable this feature, modify the Event Manager section of the dcemdy32.ini file as follows: • In Windows, locate the file at \dataeng\ini and set UnitextLog.enabled=True. The default is C:\Program Files\Dell\SysMgt. Restart the DSM SA Event Manager service.
The following example shows the Red Hat Enterprise Linux and SUSE Linux Enterprise Server message log, /var/log/messages. The text in boldface type indicates the message text. ...
Viewing the Event Information The event log for each operating system contains some or all of the following information: • Date — The date the event occurred. • Time — The local time the event occurred. • Type — A classification of the event severity: Information, Warning, or Error. • User — The name of the user on whose behalf the event occurred. • Computer — The name of the system where the event occurred. • Source — The software that logged the event.
Table 1-2.
Table 1-2.
Table 1-2.
Introduction
Event Message Reference The following tables lists in numerical order each event ID and its corresponding description, along with its severity and cause. NOTE: For corrective actions, see the appropriate documentation. Miscellaneous Messages Miscellaneous messages in Table 2-1 indicate that certain alert systems are up and working. Table 2-1. Miscellaneous Messages Event Description ID Severity Cause 0000 Log was cleared Information User cleared the log from Server Administrator.
Table 2-1. Miscellaneous Messages (continued) Event Description ID Severity Cause 1004 Thermal shutdown protection has been initiated Error This message is generated when a system is configured for thermal shutdown due to an error event. If a temperature sensor reading exceeds the error threshold for which the system is configured, the operating system shuts down and the system powers off.
Table 2-1. Miscellaneous Messages (continued) Event Description ID Severity Cause 1008 Systems Management Data Manager Started Information Systems Management Data Manager services were started. 1009 Systems Management Data Manager Stopped Information Systems Management Data Manager services were stopped. 1011 RCI table is corrupt Error This message is generated when the BIOS Remote Configuration Interface (RCI) table is corrupted or cannot be read by the systems management software.
Temperature Sensor Messages Temperature sensors listed in Table 2-2 help protect critical components by alerting the systems management console when temperatures become too high inside a chassis. The temperature sensor messages use additional variables: sensor location, chassis location, previous state, and temperature sensor value or state. Table 2-2.
Table 2-2. Temperature Sensor Messages (continued) Event Description ID Severity Cause 1052 Information A temperature sensor on the backplane board, Sensor location: drive carrier in the Chassis location: returned to a valid range after crossing Previous state was: a failure threshold.
Table 2-2. Temperature Sensor Messages (continued) Event Description ID Severity Cause 1054 Error A temperature sensor on the backplane board, system board, or drive carrier in the specified system exceeded its failure threshold. The sensor location, chassis location, previous state, and temperature sensor value are provided. Error A temperature sensor on the backplane board, system board, or drive carrier in the specified system detected an error from which it cannot recover.
Cooling Device Messages Cooling device sensors listed in Table 2-3 monitor how well a fan is functioning. Cooling device messages provide status and warning information for fans in a particular chassis. Table 2-3. Cooling Device Messages Event Description ID Severity Cause 1100 Error A fan sensor in the specified system is not functioning. The sensor location, chassis location, previous state, and fan sensor value are provided. Error A fan sensor in the specified system could not obtain a reading.
Table 2-3. Cooling Device Messages (continued) Event Description ID Severity 1102 Information A fan sensor reading on the specified system returned to a valid range after crossing a warning threshold. The sensor location, chassis location, previous state, and fan sensor value are provided.
Table 2-3. Cooling Device Messages (continued) Event Description ID Severity Cause 1104 Error A fan sensor in the specified system detected the failure of one or more fans. The sensor location, chassis location, previous state, and fan sensor value are provided. Error A fan sensor detected an error from which it cannot recover. The sensor location, chassis location, previous state, and fan sensor value are provided.
Voltage Sensor Messages Voltage sensors listed in Table 2-4 monitor the number of volts across critical components. Voltage sensor messages provide status and warning information for voltage sensors in a particular chassis. Table 2-4. Voltage Sensor Messages Event Description ID Severity Cause 1150 Voltage sensor has failed Error A voltage sensor in the specified system failed. The sensor location, chassis location, previous state, and voltage sensor value are provided.
Table 2-4. Voltage Sensor Messages (continued) Event Description ID Severity 1152 Voltage sensor returned to a normal value Information A voltage sensor in the specified system returned to a valid range after crossing a failure threshold. The sensor location, chassis location, previous state, and voltage sensor value are provided.
Table 2-4. Voltage Sensor Messages (continued) Event Description ID Severity Cause 1154 Voltage sensor detected a failure value Error A voltage sensor in the specified system exceeded its failure threshold. The sensor location, chassis location, previous state, and voltage sensor value are provided. Error A voltage sensor in the specified system detected an error from which it cannot recover. The sensor location, chassis location, previous state, and voltage sensor value are provided.
Current Sensor Messages Current sensors listed in Table 2-5 measure the amount of current (in amperes) that is traversing critical components. Current sensor messages provide status and warning information for current sensors in a particular chassis. Table 2-5. Current Sensor Messages Event Description ID Severity Cause 1200 Error A current sensor in the specified system failed. The sensor location, chassis location, previous state, and current sensor value are provided.
Table 2-5. Current Sensor Messages (continued) Event Description ID Severity Cause 1201 Error A current sensor in the specified system could not obtain a reading. The sensor location, chassis location, previous state, and a nominal current sensor value are provided.
Table 2-5. Current Sensor Messages (continued) Event Description ID Severity Cause 1203 Warning A current sensor in the specified system exceeded its warning threshold. The sensor location, chassis location, previous state, and current sensor value are provided. Error A current sensor in the specified system exceeded its failure threshold. The sensor location, chassis location, previous state, and current sensor value are provided.
Table 2-5. Current Sensor Messages (continued) Event Description ID Severity Cause 1205 Error A current sensor in the specified system detected an error from which it cannot recover. The sensor location, chassis location, previous state, and current sensor value are provided.
Chassis Intrusion Messages Chassis intrusion messages listed in Table 2-6 are a security measure. Chassis intrusion means that someone is opening the cover to a system’s chassis. Alerts are sent to prevent unauthorized removal of parts from a chassis. Table 2-6. Chassis Intrusion Messages Event Description ID 1250 Severity Chassis intrusion sensor Error has failed Sensor location: Chassis location: Cause A chassis intrusion sensor in the specified system failed.
Table 2-6. Chassis Intrusion Messages (continued) Event Description ID Severity Cause 1252 Information A chassis intrusion sensor in the specified system detected that a cover was opened while the system was operating but has since been replaced. The sensor location, chassis location, previous state, and chassis intrusion state are provided. Warning A chassis intrusion sensor in the specified system detected that a system cover is currently being opened and the system is operating.
Table 2-6. Chassis Intrusion Messages (continued) Event Description ID Severity Cause 1254 Warning A chassis intrusion sensor in the specified system detected that the system cover was opened while the system was operating. The sensor location, chassis location, previous state, and chassis intrusion state are provided.
component fails but others are still operating. Redundancy is lost when the number of components functioning falls below the redundancy threshold. Table 2-7 lists the redundancy unit messages. The number of devices required for full redundancy is provided as part of the message, when applicable, for the redundancy unit and the platform. For details on redundancy computation, see the respective platform documentation. Table 2-7.
Table 2-7. Redundancy Unit Messages (continued) Event Description ID Severity 1302 Information A redundancy sensor in the specified system detected that a unit was not redundant. The redundancy location, chassis location, previous redundancy state, and the number of devices required for full redundancy are provided.
Table 2-7. Redundancy Unit Messages (continued) Event Description ID Severity Cause 1305 Warning A redundancy sensor in the specified system detected that one of the components of the redundancy unit has failed but the unit is still redundant. The redundancy unit location, chassis location, previous redundancy state, and the number of devices required for full redundancy are provided.
Power Supply Messages Power supply sensors monitor how well a power supply is functioning. Power supply messages listed in Table 2-8 provide status and warning information for power supplies present in a particular chassis. Table 2-8. Power Supply Messages Event Description ID Severity Cause 1350 Error A power supply sensor in the specified system failed. The sensor location, chassis location, previous state, and additional power supply status information are provided.
Table 2-8. Power Supply Messages (continued) Event Description ID 1351 Severity Power supply sensor value Warning unknown Sensor location: Chassis location: Previous state was: Cause A power supply sensor in the specified system could not obtain a reading. The sensor location, chassis location, previous state, and additional power supply status information are provided.
Table 2-8. Power Supply Messages (continued) Event Description ID Severity Cause 1353 Warning A power supply sensor reading in the specified system exceeded a user-definable warning threshold. The sensor location, chassis location, previous state, and additional power supply status information are provided. Error A power supply has been disconnected or has failed. The sensor location, chassis location, previous state, and additional power supply status information are provided.
Table 2-8. Power Supply Messages (continued) Event Description ID Severity Cause 1355 Error A power supply sensor in the specified system detected an error from which it cannot recover. The sensor location, chassis location, previous state, and additional power supply status information are provided.
Memory Device Messages Memory device messages listed in Table 2-9 provide status and warning information for memory modules present in a particular system. Memory devices determine health status by monitoring the ECC memory correction rate and the type of memory events that have occurred. NOTE: A critical status does not always indicate a system failure or loss of data. In some instances, the system has exceeded the ECC correction rate.
Fan Enclosure Messages Some systems are equipped with a protective enclosure for fans. Fan enclosure messages listed in Table 2-10 monitor whether foreign objects are present in an enclosure and how long a fan enclosure is missing from a chassis. Table 2-10. Fan Enclosure Messages Event Description ID Severity Cause 1450 Critical/ Failure / Error The fan enclosure sensor in the specified system failed. The sensor location and chassis location are provided.
Table 2-10. Fan Enclosure Messages (continued) Event Description ID Severity Cause 1454 Error A fan enclosure has been removed from the specified system for a user-definable length of time. The sensor location and chassis location are provided. Error A fan enclosure sensor in the specified system detected an error from which it cannot recover. The sensor location and chassis location are provided.
AC Power Cord Messages AC power cord messages listed in Table 2-11 provide status and warning information for power cords that are part of an AC power switch, if your system supports AC switching. Table 2-11.
Table 2-11.
Table 2-12. Hardware Log Sensor Messages Event Description ID Severity Cause 1550 Warning A hardware log sensor in the specified system is disabled. The log type information is provided. Log monitoring has been disabled Log type: 1551 Log status is unknown Information A hardware log sensor in the specified system could not Log type: obtain a reading. The log type information is provided.
Processor Sensor Messages Processor sensors monitor how well a processor is functioning. Processor messages listed in Table 2-13 provide status and warning information for processors in a particular chassis. Table 2-13. Processor Sensor Messages Event Description ID Severity Cause 1600 Critical/ Failure/ Error A processor sensor in the specified system is not functioning. The sensor location, chassis location, previous state and processor sensor status are provided.
Table 2-13. Processor Sensor Messages (continued) Event Description ID Severity 1602 Information A processor sensor in the specified system transitioned back to a normal state. The sensor location, chassis location, previous state and processor sensor status are provided.
Table 2-13. Processor Sensor Messages (continued) Event Description ID Severity Cause 1604 Error A processor sensor in the specified system is disabled, has a configuration error, or experienced a thermal trip. The sensor location, chassis location, previous state and processor sensor status are provided. Error A processor sensor in the specified system has failed. The sensor location, chassis location, previous state and processor sensor status are provided.
Pluggable Device Messages The pluggable device messages listed in Table 2-14 provide status and error information when some devices, such as memory cards, are added or removed. Table 2-14. Pluggable Device Messages Event Description ID 1650 Severity Cause Information A pluggable device event message of unknown type was received. The device location, chassis Device location: location, and additional event
Table 2-14. Pluggable Device Messages (continued) Event Description ID Severity 1652 Information A device was removed from the specified system. The device location, chassis location, and additional event details, if available, are provided.
Battery Sensor Messages Battery sensors monitor how well a battery is functioning. Battery messages listed in Table provide status and warning information for batteries in a particular chassis. Table 2-15.
Table 2-15. Battery Sensor Messages (continued) Event Description ID Severity Cause 1703 Warning A battery sensor in the specified system detected that a battery is in a predictive failure state. The sensor location, chassis location, previous state, and battery sensor status are provided. Error A battery sensor in the specified system detected that a battery has failed. The sensor location, chassis location, previous state, and battery sensor status are provided.
Chassis Management Controller Messages Alerts sent by Dell™ PowerEdge™ M1000e Blade Enclosure are organized by severity. That is, the event ID of the CMC trap indicates the severity (informational, warning, critical, or non-recoverable) of the alert. Each CMC alert includes the originating system name, location, and event message text. The alert message text matches the corresponding Chassis Event Log message text that is logged by the sending CMC for that event. Table 2-16.
System Event Log Messages for IPMI Systems The tables in this chapter list the system event log (SEL) messages, their severity, and cause. NOTE: For corrective actions, see the appropriate documentation. Temperature Sensor Events The temperature sensor event messages help protect critical components by alerting the systems management console when the temperature rises inside the chassis.
Table 3-1. Temperature Sensor Events (continued) Event Message Severity Warning temperature sensor returned to warning state . temperature sensor returned to normal state . Cause Temperature of the backplane board, system board, or the carrier in the specified system returned from critical state to non-critical state.
Table 3-2. Voltage Sensor Events (continued) Event Message Severity Cause voltage sensor detected a warning . Warning Voltage of the monitored entity exceeded the warning threshold. voltage sensor returned to normal . Information The voltage of a previously reported is returned to normal state. Fan Sensor Events The cooling device sensors monitor how well a fan is functioning.
Table 3-3. Fan Sensor Events (continued) Event Message Severity Warning Fan sensor detected a warning . Cause The speed of the specified fan may not be sufficient to provide enough cooling to the system. Information The fan specified by may have failed and hence, redundancy degraded. the redundancy has been degraded.
Processor Status Events The processor status messages monitor the functionality of the processors in a system. These messages provide processor health and warning information of a system. Table 3-4. Processor Status Events Event Message Severity status Critical processor sensor IERR, where is the processor that generated the event. For example, PROC for a single processor system and PROC # for multiprocessor system.
Table 3-4. Processor Status Events (continued) Event Message Severity Cause thermal Information This event is generated when the tripped was deasserted. processor has recovered from an earlier thermal condition. configuration error was asserted. Critical This event is generated when the processor configuration is incorrect. configuration error was deasserted.
Table 3-5. Power Supply Events (continued) Event Message Severity Cause PS Redundancy sensor redundancy degraded. Information Power supply redundancy is degraded if one of the power supply sources is removed or failed. PS Redundancy sensor redundancy lost. Critical PS Redundancy sensor redundancy regained. Information This event is generated if the power supply has been reconnected or replaced.
Memory ECC Events The memory ECC event messages monitor the memory modules in a system. These messages monitor the ECC memory correction rate and the type of memory events that occurred. Table 3-6. Memory ECC Events Event Message Severity Cause ECC error correction detected on Bank # DIMM [A/B]. Information This event is generated when there is a memory error correction on a particular Dual Inline Memory Module (DIMM). ECC uncorrectable error detected on Bank # [DIMM].
Table 3-7. BMC Watchdog Events (continued) Event Message Severity Cause BMC OS Watchdog Critical performed system power off. This event is generated when the BMC watchdog detects that the system has crashed (timer expired because no response was received from Host) and the action is set to power off. BMC OS Watchdog Critical performed system power cycle.
Table 3-8. Memory Events (continued) Event Message Severity Cause Memory Mirrored redundancy lost. Critical This event is generated when redundancy is lost in a mirrored memory configuration. Memory Mirrored redundancy regained. Information This event is generated when the redundancy lost or degraded earlier is regained in a mirrored memory configuration. Memory Spared redundancy degraded. Warning This event is generated when there is a memory failure in a spared memory configuration.
Drive Events The drive event messages monitor the health of the drives in a system. These events are generated when there is a fault in the drives indicated. Table 3-10. Drive Events Event Message Severity Cause Drive Critical asserted fault state. This event is generated when the specified drive in the array is faulty. Drive deInformation asserted fault state. This event is generated when the specified drive recovers from a faulty condition.
Table 3-10. Drive Events (continued) Event Message Severity Cause Drive Critical This event is generated when the drive is placed in critical array. in critical array was asserted Drive in critical array was deasserted Drive Informational This event is generated when the drive is removed from critical array.
Intrusion Events The chassis intrusion messages are a security measure. Chassis intrusion alerts are generated when the system's chassis is opened. Alerts are sent to prevent unauthorized removal of parts from the chassis. Table 3-11. Intrusion Events Event Message Severity Cause sensor detected an intrusion. Critical This event is generated when the intrusion sensor detects an intrusion. sensor returned to normal state.
BIOS Generated System Events The BIOS-generated messages monitor the health and functionality of the chipsets, I/O channels, and other BIOS-related functions. Table 3-12. BIOS Generated System Events Event Message Severity Cause System Event I/O channel chk. Critical This event is generated when a critical interrupt is generated in the I/O Channel. System Event PCI Parity Err. Critical This event is generated when a parity error is detected on the PCI bus. System Event Chipset Err.
Table 3-12. BIOS Generated System Events (continued) Event Message Severity Err Reg Pointer Information This event is generated when an OEM event occurs. OEM events can be used by Dell™ service team to better understand the cause of the failure. OEM Diagnostic data event was asserted Cause System Board PFault Fail Safe state asserted Critical System Board PFault Fail Safe state deasserted Information This event is generated when earlier PFault Fail Safe system voltages return to a normal level.
Table 3-12. BIOS Generated System Events (continued) Event Message Severity Cause Mem Fatal SB CRC Critical This event is generated when CRC errors occur while storing to memory. Critical This event is generated when CRC errors occur while removing from memory. Critical This event is generated when system memory reaches critical temperature. Critical This event is generated when the USB exceeds a predefined current level.
Table 3-12. BIOS Generated System Events (continued) Event Message Severity Cause CPU Protocol Err Critical This event is generated when the processor protocol enters a non-recoverable state. Critical This event is generated when the processor bus PERR enters a non-recoverable state. Critical This event is generated when the processor initialization enters a non-recoverable state. Critical This event is generated when the processor machine check enters a non-recoverable state.
Table 3-12. BIOS Generated System Events (continued) Event Message Severity PCIE NonFatal Er: Non Warning Fatal IO Group sensor, PCIe error() Cause This event is generated in association with a CPU IERR. Critical This event is generated in association with a CPU IERR and indicates the PCI/PCIe device that caused the CPU IERR. Unknown system event Critical sensor unknown system hardware failure was asserted This event is generated when an unknown hardware failure is detected.
Table 3-13. POST Code Errors (continued) Fatal Error Code Description Cause 83 System BIOS shadow failure This error code indicates system BIOS shadow failure. 84 CMOS failure This error code indicates that CMOS RAM is not working. 85 DMA controller failure This error code indicates DMA controller failure. 86 Interrupt controller failure This error code indicates interrupt controller failure. 87 Timer refresh failure This error code indicates timer refresh failure.
Table 3-13. POST Code Errors (continued) Fatal Error Code Description Cause C1 POST Memory test failure This error code indicates bad memory detection. C2 RAC configuration failure Check screen for the actual error message C3 CPU configuration failure Check screen for the actual error message C4 Incorrect memory configuration Memory population order not correct. FE General failure after video Check screen for the actual error message R2 Generated System Events Table 3-14.
Cable Interconnect Events The cable interconnect messages are used for detecting errors in the hardware cabling. Table 3-15. Cable Interconnect Events Description Severity Cause Cable sensor Critical This event is generated when the cable is not connected or is incorrectly connected. Information This event is generated when the earlier cable connection error was corrected. Configuration error was asserted. Cable sensor Connection was asserted.
Power And Performance Events The power and performance events are used to detect degradation in system performance with change in power supply. Table 3-17. Power And Performance Events Description Severity Cause System Board Power Normal Optimized: Performance status sensor for System Board, degraded, was deasserted This event is generated when system performance was restored.
Storage Management Message Reference The Dell™ OpenManage™ Server Administrator Storage Management’s alert or event management features let you monitor the health of storage resources such as controllers, enclosures, physical disks, and virtual disks. Alert Monitoring and Logging The Storage Management Service performs alert monitoring and logging. By default, the Storage Management Service starts when the managed system starts up.
Alert Message Format with Substitution Variables When you view an alert in the Server Administrator alert log, the alert identifies the specific components such as the controller name or the virtual disk name to which the alert applies. In an actual operating environment, a storage system can have many combinations of controllers and disks as well as user-defined names for virtual disks and other components.
Table 4-2. Message Format with Variables for Each Storage Object Storage Object Message Variables A, B, C and X, Y, Z in the following examples are variables representing the storage object name or number. Controller Message Format: Controller A (Name) Message Format: Controller A Example: 2326 A foreign configuration has been detected.: Controller 1 (PERC 5/E Adapter) NOTE: The controller name is not always displayed.
Table 4-2. Message Format with Variables for Each Storage Object (continued) Storage Object Message Variables A, B, C and X, Y, Z in the following examples are variables representing the storage object name or number.
Alert Descriptions and Corrective Actions The following sections describe alerts generated by the RAID controllers supported by Storage Management. The alerts are displayed in the Server Administrator Alert subtab or through Windows Event Viewer. These alerts can also be forwarded. To locate an alert, scroll through the following table to find the alert number displayed on the Server Administrator Alert tab or search this file for the alert message text or number.
Table 4-4. Storage Management Messages (continued) Event ID Description Severity Cause and Action Related Alert Information 2049 Physical disk removed Warning / Non-critical Cause: A physical disk has been removed from the disk group. This alert can also be caused by loose or defective cables or by problems with the enclosure. Clear Alert Number: 2052.
Table 4-4. Storage Management Messages (continued) Event ID Description Severity Cause and Action Related Alert Information 2050 Physical disk offline Warning / Non-critical Cause: A physical disk in the disk group is offline. The user may have manually put the physical disk offline. Clear Alert Number: 2158. Action: Perform a rescan. You can also select the offline disk and perform a Make Online operation.
Table 4-4. Storage Management Messages (continued) Event ID Description Severity 2053 Virtual disk created OK / Normal / Cause: This alert is for Informational informational purposes. Cause and Action Action: None Related Alert Information Clear Alert Number: None. Related Alert Number: None. 2054 Virtual disk deleted Warning / Non-critical Cause: A virtual disk has been deleted. Performing a Reset Configuration may detect that a virtual disk has been deleted and generate this alert.
Table 4-4. Storage Management Messages (continued) Event ID Description Severity 2056 Virtual disk failed Critical / Cause: One or more Failure / Error physical disks included in the virtual disk have failed. If the virtual disk is non-redundant (does not use mirrored or parity data), then the failure of a single physical disk can cause the virtual disk to fail. If the virtual disk is redundant, then more physical disks have failed than can be rebuilt using mirrored or parity information.
Table 4-4. Storage Management Messages (continued) Event ID Description Severity Cause and Action Related Alert Information 2057 Virtual disk degraded Warning / Non-critical Cause 1: This alert message occurs when a physical disk included in a redundant virtual disk fails. Because the virtual disk is redundant (uses mirrored or parity information) and only one physical disk has failed, the virtual disk can be rebuilt. Clear Alert Number: None.
Table 4-4. Storage Management Messages (continued) Event ID Description 2057 contd. Severity Cause and Action Related Alert Information Cause 2: A physical disk in the disk group has been removed. Action 2: If a physical disk was removed from the disk group, either replace the disk or restore the original disk. You can identify which disk has been removed by locating the disk that has a red “X” for its status. Perform a rescan after replacing the disk.
Table 4-4. Storage Management Messages (continued) Event ID Description 2061 Virtual disk OK / Normal / Cause: This alert is for initializa-tion Informational informational purposes. started Action: None Severity Cause and Action Related Alert Information Clear Alert Number: 2088. Related Alert Number: None. 2062 Physical disk OK / Normal / Cause: This alert is for initializa-tion Informational informational purposes. started Action: None. Clear Alert Number: 2089. Related Alert Number: None.
Table 4-4. Storage Management Messages (continued) Event ID Description Severity 2067 Virtual disk check consistency cancelled OK / Normal / Cause: The check Informational consistency operation was cancelled because a physical disk in the array has failed or because a user cancelled the check consistency operation. Cause and Action Related Alert Information Clear Alert Number: None. Related Alert Number: None. Action: If the physical disk failed, then replace the physical disk.
Table 4-4. Storage Management Messages (continued) Event ID Description Severity 2070 Virtual disk initialization cancelled OK / Normal / Cause: The virtual disk Informational initialization cancelled because a physical disk included in the virtual disk has failed or because a user cancelled the virtual disk initialization. Cause and Action Related Alert Information Clear Alert Number: None. Related Alert Number: None. Action: If a physical disk failed, then replace the physical disk.
Table 4-4. Storage Management Messages (continued) Event ID Description Severity 2076 Virtual disk Check Consistency failed Critical / Cause: A physical disk Failure / Error included in the virtual disk failed or there is an error in the parity information. A failed physical disk can cause errors in parity information. Cause and Action Related Alert Information Clear Alert Number: None. Related Alert Number: None. Action: Replace the failed physical disk.
Table 4-4. Storage Management Messages (continued) Event ID Description Severity 2080 Physical disk initialization failed Critical / Cause: The physical disk Failure / Error has failed or is corrupt. 2081 Virtual disk Critical / Cause: A physical disk reconfigFailure / Error included in the virtual disk uration failed has failed or is corrupt. A user may also have cancelled the reconfiguration. Cause and Action Clear Alert Number: Action: Replace the failed None. or corrupt disk.
Table 4-4. Storage Management Messages (continued) Event ID Description 2082 Virtual disk Critical / Cause: A physical disk rebuild failed Failure / Error included in the virtual disk has failed or is corrupt. A user may also have cancelled the rebuild. Clear Alert Number: None. Physical disk Critical / Cause: A physical disk rebuild failed Failure / Error included in the virtual disk has failed or is corrupt. A user may also have cancelled the rebuild. Clear Alert Number: None.
Table 4-4. Storage Management Messages (continued) Event ID Description Severity 2086 Virtual disk format completed OK / Normal / Cause: This alert is for Informational informational purposes. Cause and Action Action: None Related Alert Information Clear Alert Status: Alert 2086 is a clear alert for alert 2059. Related Alert Number: None. 2087 2088 Copy of data OK / Normal / Cause: This alert is for resumed from Informational informational purposes.
Table 4-4. Storage Management Messages (continued) Event ID Description Severity 2090 Virtual disk reconfiguration completed OK / Normal / Cause: This alert is for Informational informational purposes. Cause and Action Action: None Related Alert Information Clear Alert Status: Alert 2090 is a clear alert for alert 2063. Related Alert Number: None. 2091 Virtual disk rebuild completed OK / Normal / Cause: This alert is for Informational informational purposes.
Table 4-4. Storage Management Messages (continued) Event ID Description Severity Cause and Action Related Alert Information 2094 Predictive Failure reported. Warning / Non-critical Cause: The physical disk is predicted to fail. Many physical disks contain Self Monitoring Analysis and Reporting Technology (SMART). When enabled, SMART monitors the health of the disk based on indications such as the number of write operations that have been performed on the disk. Clear Alert Number: None.
Table 4-4. Storage Management Messages (continued) Event ID Description 2094 cond. Severity Cause and Action Related Alert Information If this disk is a hot spare, then unassign the hot spare; perform the Prepare to Remove task on the disk; replace the disk; and assign the new disk as a hot spare. CAUTION: If this disk is part of a nonredundant disk, back up your data immediately. If the disk fails, you will not be able to recover the data. 2095 SCSI sense NOTE: Not data.
Table 4-4. Storage Management Messages (continued) Event ID Description 2100 Temp-erature Warning / exceeded the Non-critical maximum warning threshold Severity Cause and Action Related Alert Information Cause: The physical disk enclosure is too hot. A variety of factors can cause the excessive temperature. For example, a fan may have failed, the thermostat may be set too high, or the room temperature may be too hot. Clear Alert Number: 2353.
Table 4-4. Storage Management Messages (continued) Event ID Description 2102 Temp-erature Critical / Cause: The physical disk exceeded the Failure / Error enclosure is too hot. maximum A variety of factors can failure cause the excessive threshold temperature. For example, a fan may have failed, the thermostat may be set too high, or the room temperature may be too hot. Severity Cause and Action Related Alert Information Clear Alert Number: None. Related Alert Number: None.
Table 4-4. Storage Management Messages (continued) Event ID Description Severity 2104 Controller battery is reconditioning OK / Normal / Cause: This alert is for Informational informational purposes. 2105 Cause and Action Action: None Related Alert Information Clear Alert Number: 2105. Related Alert Number: None. Controller OK / Normal / Cause: This alert is for battery Informational informational purposes.
Table 4-4. Storage Management Messages (continued) Event ID Description 2107 Smart config- Critical / Cause: A disk has received uration Failure / Error a SMART alert (predictive change failure) after a configuration change. The disk is likely to fail in the near future. Severity Cause and Action Related Alert Information Clear Alert Number: None. Related Alert Number: None. Action: Replace the disk that has received the SMART alert.
Table 4-4. Storage Management Messages (continued) Event ID Description Severity Cause and Action Related Alert Information 2108 Smart warning Warning / Non-critical Cause: A disk has received a SMART alert (predictive failure). The disk is likely to fail in the near future. Clear Alert Number: None. Related Alert Action: Replace the disk Number: that has received the None. SMART alert.
Table 4-4. Storage Management Messages (continued) Event ID Description 2109 SMART Warning / warning Non-critical temp-erature Severity Cause and Action Related Alert Information Cause: A disk has reached an unacceptable temperature and received a SMART alert (predictive failure). The disk is likely to fail in the near future. Clear Alert Number: None. Related Alert Number: None. Action 1: Determine why the physical disk has reached an unacceptable temperature.
Table 4-4. Storage Management Messages (continued) Event ID Description 2109 contd Severity Cause and Action Make sure the enclosure has enough ventilation and that the room temperature is not too hot. See the physical disk enclosure documentation for more diagnostic information. Action 2: If you cannot identify why the disk has reached an unacceptable temperature, then replace the disk. If the physical disk is a member of a non-redundant virtual disk, then back up the data before replacing the disk.
Table 4-4. Storage Management Messages (continued) Event ID Description Severity Cause and Action Related Alert Information 2110 SMART warning degraded Warning / Non-critical Cause: A disk is degraded and has received a SMART alert (predictive failure). The disk is likely to fail in the near future. Clear Alert Number: None. Action: Replace the disk that has received the SMART alert.
Table 4-4. Storage Management Messages (continued) Event ID Description 2112 Enclosure was Critical / Cause: The physical disk shut down Failure / Error enclosure is either hotter or cooler than the maximum or minimum allowable temperature range. Severity Cause and Action Action: Check for factors that may cause overheating or excessive cooling. For example, verify that the enclosure fan is working.
Table 4-4. Storage Management Messages (continued) Event ID Description 2115 A consistency OK / Normal / check on a Informational virtual disk has been resumed Severity Cause and Action Related Alert Information Cause: The check consistency operation on a virtual disk has resumed processing after being paused by a user. This alert is for informational purposes. Clear Alert Status: Alert 2115 is a clear alert for alert 2114.
Table 4-4. Storage Management Messages (continued) Event ID Description Severity 2117 A mirrored virtual disk has been unmirrored OK / Normal / Cause: A user has caused a Informational mirrored virtual disk to be unmirrored. When a virtual disk is mirrored, its data is copied to another virtual disk in order to maintain redundancy. After being unmirrored, the disk formerly used as the mirror returns to being a physical disk and becomes available for inclusion in another virtual disk.
Table 4-4. Storage Management Messages (continued) Event ID Description Severity 2121 Device returned to normal OK / Normal / Cause: A device that was Informational previously in an error state has returned to a normal state. For example, if an enclosure became too hot and subsequently cooled down, then you may receive this alert. This alert is for informational purposes. Cause and Action Related Alert Information Clear Alert Status: Alert 2121 is a clear alert for alert 2048.
Table 4-4. Storage Management Messages (continued) Event ID Description Severity 2122 Cause and Action Related Alert Information The controller status displayed on the Health subtab indicates whether a controller has a failed or degraded component. contd. See the enclosure documentation for information on replacing enclosure components and for other diagnostic information. 2123 Redundancy lost Warning / Non-critical Cause: A virtual disk or an enclosure has lost data redundancy.
Table 4-4. Storage Management Messages (continued) Event ID Description 2123 contd. Severity Cause and Action Related Alert Information The controller status displayed on the Health subtab indicates whether a controller has a failed or degraded component. Click the controller that displays a Warning or Failed status. This action displays the controller Health subtab which displays the status of the individual controller components.
Table 4-4. Storage Management Messages (continued) Event ID Description 2125 2126 Severity Cause and Action Related Alert Information Controller Warning / cache Non-critical preserved for missing or offline virtual disk Cause: Virtual disk controller was disconnected, during IO operation. Clear Alert Number: No SCSI sense sector reassign Cause: A sector of the physical disk is corrupted and data cannot be maintained on this portion of the disk. This alert is for informational purposes.
Table 4-4. Storage Management Messages (continued) Event ID Description 2126 Severity Cause and Action Related Alert Information If the disk is part of a redundant virtual disk, then any data residing on the corrupt portion of the disk will be reallocated elsewhere in the virtual disk. contd. NOTE: Not Applicable for VMware ESXi 3.5 Update 4. 2127 Back-ground OK / Normal / Cause: BGI of a virtual disk Clear Alert initialization Informational has started. This alert is for Status: 2130.
Table 4-4. Storage Management Messages (continued) Event ID Description Severity 2130 BGI completed OK / Normal / Cause: BGI of a virtual disk Clear Alert Informational has completed. This alert is Number: for informational purposes. Alert 2130 is a clear alert for Action: None alert 2127. Cause and Action Related Alert Information Related Alert Number: None. 2131 Firmware version mismatch Warning / Non-critical Cause: The firmware on the controller is not a supported version.
Table 4-4. Storage Management Messages (continued) Event ID Description 2132 Driver version Warning / mismatch Non-critical Severity Cause and Action Related Alert Information Cause: The controller driver is not a supported version. Clear Alert Number: None. Action: Install a supported Related Alert version of the driver.. If you Number: do not have a supported None. driver version available, you can download it from the Dell Support site at support.dell.
Table 4-4. Storage Management Messages (continued) Event ID Description 2137 Comm-unica- Warning / tion Non-critical timeout Severity Cause and Action Related Alert Information Cause: The controller is unable to communicate with an enclosure. There are several reasons why communication may be lost. For example, there may be a bad or loose cable. An unusual amount of I/O may also interrupt communication with the enclosure.
Table 4-4. Storage Management Messages (continued) Event ID Description 2137 Cause and Action Enclosure OK / Normal / Cause: A user has enabled alarm enabled Informational the enclosure alarm. This alert is for informational purposes. Action: None 2139 Related Alert Information Action: Check for problems with the cables. See the online help for more information on checking the cables. You should also check to see if the enclosure has degraded or failed components.
Table 4-4. Storage Management Messages (continued) Event ID Description Severity 2140 Dead disk segments restored OK / Normal / Cause: Disk space that was Informational formerly “dead” or inaccessible to a redundant virtual disk has been restored. This alert is for informational purposes. Cause and Action Related Alert Information Clear Alert Number: None. Related Alert Number: None.
Table 4-4. Storage Management Messages (continued) Event ID Description Severity 2144 Controller alarm disabled OK / Normal / Cause: A user has disabled Informational the controller alarm. This alert is for informational purposes. Cause and Action Action: None 2145 Controller battery low Warning / Non-critical Cause: The controller battery charge is low. Related Alert Information Clear Alert Number: None. Related Alert Number: None. Clear Alert Number: None. Action: Recondition the battery.
Table 4-4. Storage Management Messages (continued) Event ID Description Severity Cause and Action Related Alert Information 2149 Bad block extended sense error Warning / Non-critical Cause: A portion of a physical disk is damaged. Clear Alert Number: None. 2150 2151 Action: See the Dell OpenManage Server Administrator Storage Management online help for more information.
Table 4-4. Storage Management Messages (continued) Event ID Description Severity 2153 Service tag changed OK / Normal / Cause: An enclosure Informational service tag was changed. In most circumstances, this service tag should only be changed by Dell support or your service provider. Cause and Action Related Alert Information Clear Alert Number: None. Related Alert Number: None. Action: Ensure that the tag was changed under authorized circumstances.
Table 4-4. Storage Management Messages (continued) Event ID Description Severity 2157 Controller configuration has been reset OK / Normal / Cause: A user has reset the Informational controller configuration. See the online help for more information. This alert is for informational purposes. Cause and Action Related Alert Information Clear Alert Number: None. Related Alert Number: None.
Table 4-4. Storage Management Messages (continued) Event ID Description Severity 2162 Communication regained OK / Normal / Cause: Communication Informational with an enclosure has been restored. This alert is for informational purposes. Cause and Action Action: None Related Alert Information Clear Alert Status: Alert 2162 is a clear alert for alerts 2137 and 2292. Related Alert Number: None.
Table 4-4. Storage Management Messages (continued) Event ID Description 2165 The RAID Warning / controller Non-critical firmware and driver validation was not performed. The configuration file cannot be opened. Severity Cause and Action Related Alert Information Cause: Storage Management is unable to determine whether the system has the minimum required versions of the RAID controller firmware and drivers. This situation may occur for a variety of reasons.
Table 4-4. Storage Management Messages (continued) Event ID Description 2167 The current Warning / kernel version Non-critical and the nonRAID SCSI driver version are older than the minimum required levels. See readme.txt for a list of validated kernel and driver versions. NOTE: Not Applicable for VMware ESXi 3.5 Update 4. Severity Cause and Action Related Alert Information Cause: The version of the kernel and the driver do not meet the minimum requirements.
Table 4-4. Storage Management Messages (continued) Event ID Description 2168 The nonWarning / RAID SCSI Non-critical driver version is older than the minimum required level. See readme.txt for the validated driver version. NOTE: Not Applicable for VMware ESXi 3.5 Update 4. 2169 Severity Cause and Action Related Alert Information Cause: The version of the driver does not meet the minimum requirements.
Table 4-4. Storage Management Messages (continued) Event ID Description 2171 The Warning / controller Non-critical battery temperature is above normal. Severity Cause and Action Related Alert Information Cause: The battery may be recharging, the room temperature may be too hot, or the fan in the system may be degraded or failed. Clear Alert Number: 2172. Related Alert Number: None.
Table 4-4. Storage Management Messages (continued) Event ID Description 2173 Un-supported Warning / configNon-critical uration detected. The SCSI rate of the enclosure man-agement modules (EMMs) is not the same. EMM0 %1 EMM1 %2. Severity Cause and Action Related Alert Information Cause: The EMMs in the enclosure have a different SCSI rate. This is an unsupported configuration. All EMMs in the enclosure should have the same SCSI rate. The % (percent sign) indicates a substitution variable.
Table 4-4. Storage Management Messages (continued) Event ID Description Severity 2175 The controller battery has been replaced. OK / Normal / Cause: This alert is for Informational informational purposes. 2176 2177 Cause and Action Action: None Related Alert Information Clear Alert Number: None. Related Alert Number: None. The OK / Normal / Cause: This alert is for controller Informational informational purposes. battery Learn Action: None cycle has started. Clear Alert Number: 2177.
Table 4-4. Storage Management Messages (continued) Event ID Description 2178 The Warning / controller Non-critical battery Learn cycle has timed out. Severity Cause and Action Related Alert Information Cause: The controller battery must be fully charged before the Learn cycle can begin. The battery may be unable to maintain a full charge causing the Learn cycle to timeout. Additionally, the battery must be able to maintain cached data for a specified period of time in the event of a power loss.
Table 4-4. Storage Management Messages (continued) Event ID Description 2180 The OK / Normal / controller Informational battery Learn cycle will start in %1 days. Severity Cause and Action Related Alert Information Cause: This alert is for informational purposes. The %1 indicates a substitution variable. The text for this substitution variable is displayed with the alert in the Alert Log and can vary depending on the situation. Clear Alert Number: None. Related Alert Number: None.
Table 4-4. Storage Management Messages (continued) Event ID Description Severity 2184 Replace member operation cancelled on physical disk OK / Normal / Cause: User cancelled the Clear Alert Informational replace member operation.
Table 4-4. Storage Management Messages (continued) Event ID Description Severity 2188 The controller write policy has been changed to Write Through. OK / Normal / Cause: The controller Informational battery is unable to maintain cached data for the required period of time. For example, if the required period of time is 24 hours, the battery is unable to maintain cached data for 24 hours.
Table 4-4. Storage Management Messages (continued) Event ID Description 2191 Multiple Critical / Cause: There are too many enclosures are Failure / Error enclosures are attached to attached to the controller port. When the controller. the enclosure limit is This is an exceeded, the controller unsupported loses contact with all configenclosures attached to uration. the port. Severity Cause and Action Related Alert Information Clear Alert Number: None.
Table 4-4. Storage Management Messages (continued) Event ID Description 2193 The virtual OK / Normal / Cause: This alert is for disk reconfig- Informational informational purposes. uration has Action: None resumed. Clear Alert Number: None. The virtual disk Read policy has changed. OK / Normal / Cause: This alert is for Informational informational purposes. Clear Alert Number: None. Dedicated hot spare assigned.
Table 4-4. Storage Management Messages (continued) Event ID Description Severity 2198 The physical disk is too small to be used for Replace member operation OK / Normal / Cause: Replace member Informational operation cannot be performed on the physical disk as the target disk is smaller for than the source disk. This alert is for informational purposes.
Table 4-4. Storage Management Messages (continued) Event ID Description Severity Cause and Action Related Alert Information 2201 A global hot spare failed. Warning / Non-critical Cause: The controller is not able to communicate with a disk that is assigned as a dedicated hot spare. The disk may have been removed. There may also be a bad or loose cable. Clear Alert Number: None. Related Alert Number: 2048 Action: Check if the disk is healthy and that it has not been removed. Check the cables.
Table 4-4. Storage Management Messages (continued) Event ID Description Severity Cause and Action Related Alert Information 2203 A dedicated hot spare failed. Warning / Non-critical Cause: The controller is unable to communicate with a disk that is assigned as a dedicated hot spare. The disk may have failed or been removed. There may also be a bad or loose cable. Clear Alert Number: None. Related Alert Number: 2048 Action: Check if the disk is healthy and that it has not been removed.
Table 4-4. Storage Management Messages (continued) Event ID Description 2206 The only hot Warning / spare Non-critical available is a SATA disk. SATA disks cannot replace SAS disks. Severity Cause and Action Related Alert Information Cause: The only physical disk available to be assigned as a hot spare is using SATA technology. The physical disks in the virtual disk are using SAS technology.
Table 4-4. Storage Management Messages (continued) Event ID Description Severity Cause and Action 2210 Battery requires reconditioning. Initiate the battery learn cycle. Warning / Non-critical Cause: Battery requires reconditioning. 2211 The physical disk is not supported. Warning / Non-critical Cause: The physical disk may not have a supported version of the firmware or the disk may not be supported by Dell. Clear Alert Number: Action: Initiate the battery None. learn cycle.
Table 4-4. Storage Management Messages (continued) Event ID Description Severity 2214 Battery charge in progress OK / Normal / Cause: This alert is for Informational informational purposes. Cause and Action Action: None. Related Alert Information Clear Alert Number: None. Related Alert Number: None. 2215 2216 2217 2218 Battery charge process interrupted OK / Normal / Cause: This alert is for Informational informational purposes. The battery learn mode has changed to auto.
Table 4-4. Storage Management Messages (continued) Event ID Description 2219 Abort Check OK / Normal / Cause: This alert is for Consistency Informational informational purposes. on Error, Action: None Allow Revertible Hot Spare and Replace Member, Auto Replace Member on Predictive Failure, and Load balance changed. Clear Alert Number: None. Allow OK / Normal / Cause: This alert is for Revertible Informational informational purposes.
Table 4-4. Storage Management Messages (continued) Event ID Description 2222 2223 2224 2225 Severity Cause and Action Related Alert Information Load balance OK / Normal / and Auto Informational Replace Member operation on Predictive Failure changed. Cause: This alert is generated due to user initiated change in controller properties. This alert is for informational purposes. Clear Alert Number: None.
Table 4-4. Storage Management Messages (continued) Event ID Description 2226 Load balance OK / Normal / Cause: This alert is for changed Informational informational purposes. Severity Cause and Action Action: None Related Alert Information Clear Alert Number: None. Related Alert Number: None. 2227 2228 148 Abort Check OK / Normal / Consistency Informational on Error, Allow Revertible Hot Spare and Replace Member, and Auto Replace Member Operation on Predictive Failure changed.
Table 4-4. Storage Management Messages (continued) Event ID Description 2229 Abort Check OK / Normal / Consistency Informational on Error and Auto Replace Member operation on Predictive Failure changed. 2230 2231 2232 Severity Cause and Action Related Alert Information Cause: This alert is generated due to user initiated change in controller properties. This alert is for informational purposes. Clear Alert Number: None. Related Alert Number: None.
Table 4-4. Storage Management Messages (continued) Event ID Description 2233 The BackOK / Normal / Cause: This alert is for ground Informational informational purposes. initialization Action: None (BGI) rate has changed. Clear Alert Number: None. The Patrol OK / Normal / Cause: This alert is for Read rate has Informational informational purposes. changed. Action: None Clear Alert Number: None. 2234 Severity Cause and Action Related Alert Information Related Alert Number: None.
Table 4-4. Storage Management Messages (continued) Event ID Description 2238 The OK / Normal / controller Informational debug log file has been exported. Severity Cause and Action Related Alert Information Cause: The user has attempted to export the controller debug log. This alert is for informational purposes. Clear Alert Number: None. Action: None 2239 A foreign OK / Normal / configInformational uration has been cleared. Cause: The user has attempted to clear a foreign configuration.
Table 4-4. Storage Management Messages (continued) Event ID Description Severity 2243 The Patrol Read has stopped. OK / Normal / Cause: The controller has Informational stopped the Petrol Read operation. This alert is for informational purposes. Cause and Action Action: None Related Alert Information Clear Alert Status: Alert 2243 is a clear alert for alert 2242. Related Alert Number: None.
Table 4-4. Storage Management Messages (continued) Event ID Description Severity 2247 The controller battery is charging. OK / Normal / Cause: This alert is for Informational informational purposes. The controller battery is executing a Learn cycle. OK / Normal / Cause: This alert is for Informational informational purposes. 2248 2249 2250 Cause and Action Action: None Clear Alert Number: 2358. Related Alert Number: None. Action: None Clear Alert Number: None. Related Alert Number: None.
Table 4-4. Storage Management Messages (continued) Event ID Description 2252 The physical OK / Normal / Cause: This alert is for disk blink has Informational informational purposes. ceased. Action: None Severity Cause and Action Related Alert Information Clear Alert Number: None. Related Alert Number: None. 2253 Redundant OK / Normal / Cause: This alert is Clear Alert path restored Informational provided for informational Number: purposes. None. Action: None.
Table 4-4. Storage Management Messages (continued) Event ID Description 2258 Controller Warning / has preserved Non-critical cache Severity Cause and Action Related Alert Information Cause: IO interrupted for a virtual disk which is connected to the controller. Clear Alert Number: None. Related Alert Action: Check for foreign Number: configuration and import if None. any. Check for cable fault. Recover any virtual disk lost by the controller.
Table 4-4. Storage Management Messages (continued) Event ID Description Severity 2263 SMART thermal shutdown is disabled. OK / Normal / Cause: This alert is for Informational informational purposes. A device is missing. Warning / Non-critical 2264 Cause and Action Action: None Related Alert Information Clear Alert Number: None. Related Alert Number: None. Cause: The controller cannot communicate with a device. The device may be removed. There may also be a bad or loose cable.
Table 4-4. Storage Management Messages (continued) Event ID Description 2265 A device is in Warning / an unknown Non-critical state. Severity Cause and Action Related Alert Information Cause: The controller cannot communicate with a device. The state of the device cannot be determined. There may be a bad or loose cable. The system may also be experiencing problems with the application programming interface (API). There could also be a problem with the driver or firmware. Clear Alert Number: None.
Table 4-4. Storage Management Messages (continued) Event ID Description Severity 2267 The controller reconstruct rate has changed. OK / Normal / Cause: This alert is for Informational informational purposes. 2268 2269 158 Cause and Action Action: None Related Alert Information Clear Alert Number: None. Related Alert Number: None. %1, Storage Critical / Cause: Storage Management Failure / Error Management has lost has lost communication with a communicacontroller.
Table 4-4. Storage Management Messages (continued) Event ID Description Severity 2270 The physical disk Clear operation failed. Critical / Cause: A Clear task was Failure / Error being performed on a physical disk but the task was interrupted and did not complete successfully. The controller may have lost communication with the disk. The disk may have been removed or the cables may be loose or defective. Cause and Action Related Alert Information Clear Alert Number: None.
Table 4-4. Storage Management Messages (continued) Event ID Description 2272 Patrol Read Critical / Cause: The Patrol Read found an un- Failure / Error task has encountered an correctable error that cannot be media error. corrected. There may be a bad disk block that cannot be remapped. Severity Cause and Action Related Alert Information Clear Alert Number: None. Related Alert Number: None. Action: Back up your data.
Table 4-4. Storage Management Messages (continued) Event ID Description 2274 The physical OK / Normal / Cause: This alert is for disk rebuild Informational informational purposes. has resumed. Action: None Severity Cause and Action Related Alert Information Clear Alert Number: None. Related Alert Number: None. 2276 2277 The Warning / dedicated hot Non-critical spare is too small. Cause: The dedicated hot spare is not large enough to protect all virtual disks that reside on the disk group.
Table 4-4. Storage Management Messages (continued) Event ID Description 2278 The OK / Normal / controller Informational battery charge level is below a normal threshold. Severity Cause and Action Related Alert Information Cause: The battery is discharging. A battery discharge is a normal activity during the battery Learn cycle. Before completing, the battery Learn cycle recharges the battery. You should receive alert 2179 when the recharge occurs. Clear Alert Number: None.
Table 4-4. Storage Management Messages (continued) Event ID Description 2280 A disk media OK / Normal / Cause: A disk media error error has been Informational was detected while the corrected. controller was completing a background task. A bad disk block was identified. The disk block has been remapped. Severity Cause and Action Related Alert Information Clear Alert Number: None. Related Alert Number: None. Action: Consider replacing the disk.
Table 4-4. Storage Management Messages (continued) Event ID Description 2282 Hot spare Critical / Cause: The controller SMART Failure / Error firmware attempted a polling failed. SMART polling on the hot spare but was unable to complete it. The controller has lost communication with the hot spare. Severity Cause and Action Related Alert Information Clear Alert Number: None. Related Alert Number: None. Action: Check the health of the disk assigned as a hot spare.
Table 4-4. Storage Management Messages (continued) Event ID Description 2286 A Learn cycle OK / Normal / Cause: This alert is for start is Informational informational purposes. pending while Action: None the battery charges. Clear Alert Number: None. The Patrol Read is paused. Clear Alert Number: 2288. 2287 Severity Cause and Action OK / Normal / Cause: This alert is for Informational informational purposes. Action: None Related Alert Information Related Alert Number: None.
Table 4-4. Storage Management Messages (continued) Event ID Description Severity 2289 Multi-bit ECC error. Critical / Cause: An error involving Failure / Error multiple bits has been encountered during a read or write operation. The error correction algorithm recalculates parity data during read and write operations. If an error involves only a single bit, it may be possible for the error correction algorithm to correct the error and maintain parity data.
Table 4-4. Storage Management Messages (continued) Event ID Description Severity Cause and Action Related Alert Information 2290 Single-bit ECC error. Warning / Non-critical Cause: An error involving a single bit has been encountered during a read or write operation. The error correction algorithm has corrected this error. Clear Alert Number: None. Related Alert Number: None. Action: None 2291 An EMM has OK / Normal / Cause: This alert is for been Informational informational purposes.
Table 4-4. Storage Management Messages (continued) Event ID Description 2294 A device has OK / Normal / Cause: This alert is for been inserted. Informational informational purposes. Severity Cause and Action Action: None Related Alert Information Clear Alert Number: None. Related Alert Number: None. 2295 A device has been removed. Critical / Cause: A device has been Failure / Error removed and the system is no longer functioning in optimal condition. Clear Alert Number: None.
Table 4-4. Storage Management Messages (continued) Event ID Description 2298 There is a bad Warning / sensor on an Non-critical enclosure. Severity Cause and Action Related Alert Information Cause: The enclosure has a bad sensor. The enclosure sensors monitor the fan speeds, temperature probes, etc. The %1indicates a substitution variable. The text for this substitution variable is displayed with the alerts in the Alert Log and can vary depending on the situation. Clear Alert Number: None.
Table 4-4. Storage Management Messages (continued) Event ID Description 2300 The enclosure Critical / Cause: The controller is is unstable. Failure / Error not receiving a consistent response from the enclosure. There could be a firmware problem or an invalid cabling configuration. If the cables are too long, they will degrade the signal. Severity Cause and Action Related Alert Information Clear Alert Number: None. Related Alert Number: None.
Table 4-4. Storage Management Messages (continued) Event ID Description 2302 The enclosure Critical / Cause: The enclosure or an Clear Alert is not Failure / Error enclosure component is in Number: responding. a Failed or Degraded state. None. Severity Cause and Action Related Alert Information Action: Check the health Related Alert of the enclosure and its Number: components. Replace any None. hardware that is in a Failed state. See the hardware documentation for more information.
Table 4-4. Storage Management Messages (continued) Event ID Description Severity Cause and Action Related Alert Information 2305 The physical disk is too small to be used for a rebuild. Warning / Non-critical Cause: The physical disk is too small to rebuild the data. Clear Alert Number: None. 172 Action: Remove the Related Alert physical disk and insert Number: a new physical disk that is 2326 the same size or larger than the disk that is being rebuilt.
Table 4-4. Storage Management Messages (continued) Event ID Description Severity Cause and Action Related Alert Information 2306 Bad block table is 80% full. Warning / Non-critical Cause: The bad block table is used for remapping bad disk blocks. This table fills, as bad disk blocks are remapped. When the table is full, bad disk blocks can no longer be remapped, and disk errors can no longer be corrected. At this point, data loss can occur. The bad block table is now 80% full.
Table 4-4. Storage Management Messages (continued) Event ID Description 2309 A physical Warning / disk is incom- Non-critical patible. Severity Cause and Action Related Alert Information Cause: You have attempted to replace a disk with another disk that is using an incompatible technology. For example, you may have replaced one side of a mirror with a SAS disk when the other side of the mirror is using SATA technology. Clear Alert Number: None. Related Alert Number: None.
Table 4-4. Storage Management Messages (continued) Event ID Description 2311 The firmware Warning / on the EMMs Non-critical is not the same version. EMM0 %1 EMM1 %2 Severity Cause and Action Related Alert Information Cause: The firmware on the EMM modules is not the same version. It is required that both modules have the same version of the firmware. This alert may be caused if you attempt to insert an EMM module that has a different firmware version than an existing module.
Table 4-4. Storage Management Messages (continued) Event ID Description 2314 The Critical / Cause: Storage initialization Failure / Error Management is unable sequence of to monitor or manage SAS SAS devices. components Action: Reboot the system. failed during If problem persists, make system sure you have supported startup. SAS versions of the drivers and management firmware. Also, you may and need to reinstall Storage monitoring is Management or Server not possible.
Table 4-4. Storage Management Messages (continued) Event ID Description Severity 2316 Diagnostic message %1 Critical / Cause: A diagnostics test Failure / Error failed. The %1 indicates a substitution variable. The text for this substitution variable is generated by the utility that ran the diagnostics and is displayed with the alert in the Alert Log. This text can vary depending on the situation. Cause and Action Related Alert Information Clear Alert Number: None. Related Alert Number: None.
Table 4-4. Storage Management Messages (continued) Event ID Description 2319 Single-bit Warning / ECC error. Non-critical The DIMM is degrading. 2320 178 Severity Cause and Action Related Alert Information Cause: The DIMM is Clear Alert beginning to malfunction. Number: None. Action: Replace the DIMM to avoid data loss or Related Alert data corruption. The Number: DIMM is a part of the 2320 controller battery pack.
Table 4-4. Storage Management Messages (continued) Event ID Description 2321 Single-bit Critical / Cause: The DIMM is ECC error. Failure / Error malfunctioning. Data loss The DIMM is or data corruption is critically imminent. The DIMM degraded. must be replaced There will be immediately. No further no further alerts will be generated. reporting. Action: Replace the DIMM immediately. The DIMM is a part of the controller battery pack. See your hardware documentation for information on replacing the DIMM.
Table 4-4. Storage Management Messages (continued) Event ID Description Severity 2323 The power supply is switched on. OK / Normal / Cause: This alert is for Informational informational purposes. Cause and Action Action: None Related Alert Information Clear Alert Status: Alert 2323 is a clear alert for alerts 2313 and 2322. Related Alert Number: None. 2324 The AC Critical / Cause: The power cable power supply Failure / Error may be pulled out cable has or removed.
Table 4-4. Storage Management Messages (continued) Event ID Description Severity 2326 A foreign configuration has been detected. OK / Normal / Cause: This alert is for Informational informational purposes. The controller has physical disks that were moved from another controller. These physical disks contain virtual disks that were created on the other controller.
Table 4-4. Storage Management Messages (continued) Event ID Description Severity Cause and Action Related Alert Information 2329 SAS port report: %1 Warning / Non-critical Cause: The text for this alert is generated by the controller and can vary depending on the situation. The %1 indicates a substitution variable. The text for this substitution variable is generated by the controller and is displayed with the alert in the Alert Log. This text can vary depending on the situation.
Table 4-4. Storage Management Messages (continued) Event ID Description Severity 2330 SAS port report: %1 OK / Normal / Cause: The %1 indicates Informational a substitution variable. The text for this substitution variable is generated by the controller and is displayed with the alert in the Alert Log. This text can vary depending on the situation. This alert is for informational purposes. Cause and Action Related Alert Information Clear Alert Number: None. Related Alert Number: None.
Table 4-4. Storage Management Messages (continued) Event ID Description 2334 Controller OK / Normal / Cause: The %1 indicates a event log: %1 Informational substitution variable. The text for this substitution variable is generated by the controller and is displayed with the alert in the Alert Log. This text is from events in the controller event log that were generated while Storage Management was not running. This text can vary depending on the situation. This alert is for informational purposes.
Table 4-4. Storage Management Messages (continued) Event ID Description 2335 Controller Warning / event log: %1 Non-critical Severity Cause and Action Related Alert Information Cause: The %1 indicates a substitution variable. The text for this substitution variable is generated by the controller and is displayed with the alert in the Alert Log. This text is from events in the controller event log that were generated while Storage Management was not running.
Table 4-4. Storage Management Messages (continued) Event ID Description 2336 Controller Critical / Cause: The %1 indicates a event log: %1 Failure / Error substitution variable. The text for this substitution variable is generated by the controller and is displayed with the alert in the Alert Log. This text is from events in the controller event log that were generated while Storage Management was not running. This text can vary depending on the situation.
Table 4-4. Storage Management Messages (continued) Event ID Description 2338 The OK / Normal / Cause: This alert is for controller has Informational informational purposes. recovered Action: None cached data from the BBU. Clear Alert Number: None. The factory OK / Normal / Cause: This alert is for default Informational informational purposes. settings have Action: None been restored. Clear Alert Number: None. 2339 Severity Cause and Action Related Alert Information Related Alert Number: None.
Table 4-4. Storage Management Messages (continued) Event ID Description 2340 The BGI Critical / Cause: The BGI task completed Failure / Error encountered errors that with cannot be corrected. un-correctable The virtual disk contains errors. physical disks that have unusable disk space or disk errors that cannot be corrected. Severity Cause and Action Related Alert Information Clear Alert Number: None. Related Alert Number: None. Action: Replace the physical disk that contains the disk errors.
Table 4-4. Storage Management Messages (continued) Event ID Description 2342 2343 Severity Cause and Action Related Alert Information The Check Warning / Consistency Non-critical found inconsist-ent parity data. Data redundancy may be lost. Cause: The data on a source disk and the redundant data on a target disk is inconsistent. Clear Alert Number: None. The Check Warning / Consistency Non-critical logging of inconsistent parity data is disabled.
Table 4-4. Storage Management Messages (continued) Event ID Description 2346 Error Warning / occurred: %1 Non-critical Severity Cause and Action Related Alert Information Cause: A physical device may have an error. The %1 indicates a substitution variable. The text for this substitution variable is generated by the firmware and is displayed with the alert in the Alert Log. This text can vary depending on the situation. Clear Alert Number: None.
Table 4-4. Storage Management Messages (continued) Event ID Description 2348 The rebuild Critical / Cause: You are attempting failed due to Failure / Error to rebuild data on a disk errors on the that is defective. target Action: Replace the target physical disk. disk. If a rebuild does not automatically start after replacing the disk, initiate the Rebuild task. You may need to assign the new disk as a hot spare to initiate the rebuild. Clear Alert Number: None.
Table 4-4. Storage Management Messages (continued) Event ID Description 2352 A physical OK / Normal / Cause: This alert is for disk that was Informational informational purposes. marked as Action: None. missing has been replaced. Clear Alert Status: Alert 2352 is a clear alert for alert 2351. The enclosure OK / Normal / Cause: This alert is for temp-erature Informational informational purposes. has returned Action: None. to normal.
Table 4-4. Storage Management Messages (continued) Event ID Description 2356 SAS SMP Critical / Cause: The %1 indicates a communicati Failure / Error substitution variable. ons error %1. The text for this substitution variable is generated by the firmware and is displayed with the alert in the Alert Log. This text can vary depending on the situation. The reference to SMP in this text refers to SAS Management Protocol. Severity Cause and Action Related Alert Information Clear Alert Number: None.
Table 4-4. Storage Management Messages (continued) Event ID Description 2357 SAS expander Critical / Cause: The %1 indicates a error: %1 Failure / Error substitution variable. The text for this substitution variable is generated by the firmware and is displayed with the alert in the Alert Log. This text can vary depending on the situation. Severity Cause and Action Related Alert Information Clear Alert Number: None. Related Alert Number: None. Action: There may be a problem with the enclosure.
Table 4-4. Storage Management Messages (continued) Event ID Description Severity Cause and Action Related Alert Information 2359 The physical disk is not certified. Warning / Non-critical Cause: The physical disk does not comply with the standards set by Dell and is not supported. Clear Alert Number: None. Action: Replace the physical disk with a physical disk that is supported. 2360 2361 Related Alert Number: None.
Table 4-4. Storage Management Messages (continued) Event ID Description 2362 Physical OK / Normal / Cause: This alert is for disk(s) have Informational informational purposes. been removed Action: None. from a virtual disk. The virtual disk will be in Failed state during the next system reboot. Clear Alert Number: None. All virtual OK / Normal / Cause: This alert is for disks are Informational informational purposes. missing from Action: None. the controller.
Table 4-4. Storage Management Messages (continued) Event ID Description 2367 Rebuild not Warning / possible as Non-critical SAS/SATA is not supported in the same virtual disk. 2368 Severity Cause and Action Related Alert Information Cause: The physical disk is Clear Alert using an incompatible Number: technology. None. Action: All physical disks in Related Alert the virtual disk must use Number: the same technology. You 2326 cannot use both SAS and SATA physical disks in the same virtual disk.
Table 4-4. Storage Management Messages (continued) Event ID Description 2369 Virtual Disk OK / Normal / Re-dundancy Informational has been degraded. Severity Cause and Action Related Alert Information Cause: A physical disk in a RAID 6 virtual disk has either failed or been removed. Clear Alert Number: 2121. Action: Replace the missing or failed physical disk.
Table 4-4. Storage Management Messages (continued) Event ID Description Severity 2373 Attempted import of unsupported Virtual Disk type RAID %1 OK / Normal / Cause: This alert is Informational provided for informational purposes. User is attempting to import a foreign virtual disk with unsupported RAID level on the controller Cause and Action Related Alert Information Clear Alert Number: None. Related Alert Number: None. Action: None.
Table 4-4. Storage Management Messages (continued) Event ID Description 2378 Attempted OK / Normal / import of an Informational incomp-atible physical drive Severity Cause and Action Related Alert Information Cause: User is attempting to import an incompatible physical drive. This alert is provided for informational purposes. Clear Alert Number: None. Action: None. 2379 2380 200 Related Alert Number: None. An overflow OK / Normal / of the foreign Informational configuration has occurred.
Table 4-4. Storage Management Messages (continued) Event ID Description Severity 2381 Controller preserved cache is recovered. OK / Normal / Cause: This alert is Clear Alert Informational provided for informational Number: purposes. None. 2382 An unWarning / supported Non-critical configuration was detected. The controlle r does not support physical disks of type Solid State Device (SSD): Cause and Action Related Alert Information Action: None Related Alert Number: None.
Storage Management Message Reference
Index Symbols 1050, 22 %1, Storage Management has lost communication with this RAID controller and attached storage. An immediate reboot is strongly recommended to avoid further problems. If the reboot does not restore communication, there may be a hardware failure.
1250, 35 1500, 48 1251, 35 1501, 48 1252, 36 1502, 48 1253, 36 1503, 49 1254, 37 1504, 49 1255, 37 1505, 49 1300, 38 1550, 50 1301, 38 1551, 50 1302, 39 1552, 50 1303, 39 1553, 50 1304, 39 1554, 50 1305, 40 1555, 50 1306, 40 1600, 51 1350, 41 1601, 51 1351, 42 1602, 52 1352, 42 1603, 52 1353, 43 1604, 53 1354, 43 1605, 53 1355, 44 1650, 54 1403, 45 1651, 54 1404, 45 1652, 55 1450, 46 1653, 55 1451, 46 1700, 56 1452, 46 1701, 56 1453, 46 1702, 56 1454, 47 17
1705, 57 2075, 94 2000, 58 2076, 95 2002, 58 2077, 95 2003, 58 2079, 95 2004, 58 2080, 96 2005, 58 2081, 96 2048, 85 2082, 97 2049, 86 2083, 97 2050, 87 2085, 97 2051, 87 2086, 98 2052, 87 2087, 98 2053, 88 2088, 98 2054, 88 2089, 98 2055, 88 2090, 99 2056, 89 2091, 99 2057, 90 2092, 99 2058, 91 2094, 100 2059, 91 2095, 101 2060, 91 2098, 101 2061, 92 2099, 101 2062, 92 2100, 102 2063, 92 2101, 102 2064, 92 2102, 103 2065, 92 2103, 103 2067, 93 2104, 104 207
2107, 105 2138, 121 2108, 106 2139, 121 2109, 107 2140, 122 2110, 109 2141, 122 2111, 109 2142, 122 2112, 110 2143, 122 2114, 110 2144, 123 2115, 111 2145, 123 2116, 111 2146, 123 2117, 112 2147, 123 2118, 112 2148, 123 2120, 112 2149, 124 2121, 113 2150, 124 2122, 113 2151, 124 2123, 114 2152, 124 2124, 115 2153, 125 2125, 116 2154, 125 2126, 116 2155, 125 2127, 117 2156, 125 2128, 117 2157, 126 2129, 117 2158, 126 2130, 118 2159, 126 2131, 118 2162, 127 2132,
2167, 129 2195, 139 2168, 130 2196, 139 2169, 130 2197, 139 2170, 130 2198, 140 2171, 131 2199, 140 2173, 132 2200, 140 2174, 132 2201, 141 2175, 133 2202, 141 2176, 133 2203, 142 2177, 133 2204, 142 2178, 134 2205, 142 2179, 134 2206, 143 2180, 135 2207, 143 2181, 135 2210, 144 2182, 135 2211, 144 2183, 135 2212, 144 2184, 136 2213, 144 2185, 136 2214, 145 2186, 136 2215, 145 2187, 136 2216, 145 2188, 137 2217, 145 2189, 137 2218, 145 2190, 137 2219, 146 2191,
2224, 147 2254, 154 2226, 148 2255, 154 2227, 148 2257, 154 2228, 148 2258, 155 2229, 149 2259, 155 2230, 149 2260, 155 2231, 149 2261, 155 2232, 149 2262, 155 2233, 150 2263, 156 2234, 150 2264, 156 2235, 150 2265, 157 2236, 150 2266, 157 2237, 150 2267, 158 2238, 151 2268, 158 2239, 151 2269, 158 2240, 151 2270, 159 2241, 151 2271, 159 2242, 151 2272, 160 2243, 152 2273, 160 2244, 152 2274, 161 2245, 152 2276, 161 2246, 152 2277, 161 2247, 153 2278, 162 2248,
2285, 164 2313, 175 2286, 165 2314, 176 2287, 165 2315, 176 2288, 165 2316, 177 2289, 166 2318, 177 2290, 167 2319, 178 2291, 167 2320, 178 2292, 167 2321, 179 2293, 167 2322, 179 2294, 168 2323, 180 2295, 168 2324, 180 2296, 168 2325, 180 2297, 168 2326, 181 2298, 169 2327, 181 2299, 169 2328, 181 2300, 170 2329, 182 2301, 170 2330, 183 2302, 171 2331, 183 2303, 171 2332, 183 2304, 171 2334, 184 2305, 172 2335, 185 2306, 173 2336, 186 2307, 173 2337, 186 2309,
2342, 189 2375, 199 2343, 189 2376, 199 2346, 190 2377, 199 2347, 190 2378, 200 2348, 191 2379, 200 2349, 191 2380, 200 2350, 191 2381, 201 2351, 191 2382, 201 2352, 192 2353, 192 2356, 193 2357, 194 2358, 194 2359, 195 2360, 195 2361, 195 2362, 196 2364, 196 2366, 196 2367, 197 2368, 197 2369, 198 2370, 198 2371, 198 2372, 198 2373, 199 2374, 199 210 Index A A bad disk block could not be reassigned during a write operation., 191 A bad disk block has been reassigned.
A dedicated hot spare has been automatically unassigned., 142 A dedicated hot spare has been removed., 142 A device has been inserted., 168 A device has been removed., 168 A device is in an unknown state., 157 A device is missing., 156 A disk media error has been corrected., 163 A physical disk is marked as missing., 191 A physical disk that was marked as missing has been replaced., 192 A power supply in the enclosure has a DC failure., 175 A power supply in the enclosure has an AC failure.
AC power has been restored, 48 B All virtual disks are missing from the controller. This situation was discovered during system start-up., 196 Background initialization cancelled, 117 An attempt to hot plug an EMM has been detected. This type of hot plug is not supported., 171 An EMM has been discovered., 167 An EMM has been inserted., 168 An EMM has been removed., 168 An enclosure blink has ceased, 155 An enclosure blink operation has initiated., 155 An invalid SAS configuration has been detected.
C cable interconnect messages, 79 Change write policy, 112 Chassis intrusion detected, 37, 65 Chassis intrusion in progress, 36, 65 chassis intrusion messages, 35 Chassis intrusion returned to normal, 36 chassis intrusion sensor, 9 Chassis intrusion sensor detected a non-recoverable value, 37, 65 Chassis intrusion sensor has failed, 35 Chassis intrusion sensor value unknown, 35, 64 Chassis Management Controller Messages, 37 Communication regained, 127 Communication timeout, 120 Communication with the enclos
Dedicated hot spare unassigned.
G M Global hot spare assigned, 101 Maximum temperature probe warning threshold value changed, 125 Global hot spare unassigned, 101 H hardware log sensor, 10 Hardware Log Sensor Events, 68 hardware log sensor messages, 68 Hot spare SMART polling failed.
intrusion, 71 memory device, 45 memory ecc, 66 memory modules, 67 miscellaneous, 19 pluggable device, 54, 72 power supply, 41, 64 processor sensor, 51 processor status, 63 r2 generated system, 76 redundancy unit, 37 storage management, 85 temperature sensor, 22, 59 voltage sensor, 28, 60 Minimum temperature probe warning threshold value changed, 125 Multi-bit ECC error., 166 Multiple enclosures are attached to the controller. This is an unsupported configuration.
power supply messages, 41, 64 R Power supply returned to normal, 42, 67 r2 generated system messages, 76 power supply sensor, 10 Rebuild completed with errors, 127 Power supply sensor detected a non-recoverable value, 44 Power supply sensor has failed, 41 Rebuild not possible as SAS/ SATA is not supported in the same virtual disk.
SCSI sense data, 101 SCSI sense sector reassign, 116 See the Readme file for a list of validated controller driver versions, 127 sensor AC power cord, 10 chassis intrusion, 9 current, 9 fan, 9 fan enclosure, 10 hardware log, 10 memory prefailure, 10 power supply, 10 processor, 10, 51 redundancy unit, 10 temperature, 9 voltage, 9 Server Administrator starting, 19 Server Administrator startup complete, 19 Service tag changed, 125 Single-bit ECC error limit exceeded., 136 Single-bit ECC error.
temperature sensor, 9 Temperature sensor detected a failure value, 24 Temperature sensor detected a non-recoverable value, 24 Temperature sensor detected a warning value, 23 Temperature Sensor Events, 59 Temperature sensor has failed, 22, 59 temperature sensor messages, 22, 59 Temperature sensor returned to a normal value, 23, 60 The Check Consistency made corrections and completed., 188 The Check Consistency rate has changed., 150 The Clear operation has cancelled., 154 The controller alarm is silenced.
The controller battery Learn cycle has started., 133 The controller battery Learn cycle has timed out., 134 The controller battery Learn cycle will start in % days., 135 The controller battery needs to be replaced., 130 The controller battery temperature is above normal, 131 The controller battery temperature is above normal., 144 The controller battery temperature is normal., 131 The controller cache has been discarded., 136 The controller debug log file has been exported.
The initialization sequence of SAS components failed during system startup. SAS management and monitoring is not possible., 176 The non-RAID SCSI driver version is older than the minimum required level.See the Readme file for the validated driver version., 130 The NVRAM has corrupt data., 181 The Patrol Read rate has changed., 150 The physical disk blink has ceased., 154 The physical disk blink has initiated., 153 The physical disk Clear operation failed.
The RAID controller firmware and driver validation was not performed. The configuration file is out of date or corrupted., 128 The rebuild failed due to errors on the source physical disk., 190 The rebuild failed due to errors on the target physical disk., 191 The SCSI Enclosure Processor (SEP) has been rebooted as part of the firmware download operation and will be unavailable until the operation completes., 197 The virtual disk cache policy has changed.
Virtual disk deleted, 88 Virtual disk failed, 89 Virtual disk format changed, 95 Virtual disk format completed, 98 Virtual disk format started, 91 Virtual disk has inconsistent data.
Index