
User's Manual


Fluid Cache for DAS 81
In the Read/Write Bytes per Second for Fluid Cache Disk graph, the
performance of cache read, cache write, disk read and disk write for the
specified Fluid Cache disk and time interval is plotted. You can click on the
legend to compare the entries with one another. For example, you can grey
out the cache write and disk write and compare the cache read and disk read
performance. Hover the cursor over the line graph to display the Read/Write
performance details for a specific time. The legend also provides additional
information about the average bytes read/written for the respective Fluid
Cache Disk.
The I/O Operations per second for Fluid Cache Disk graph plots the I/O
operations per second for the chosen Fluid Cache disk and back-end disk in
the specified time interval. Hovering the cursor over the line graph provides
the Read/Write performance details for specific time. The legend also
provides additional information about the average read or write operation
performed during a specific time.
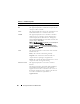
Table 6-5. Fluid Cache Disk Performance
Properties Description
Fluid Cache
Disk
Select the Fluid Cache disk from the drop-down
option to view the performance information. The
drop-down list contains the list of all Fluid Cache
disks irrespective of the state (failed, active.)
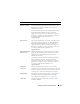
Time Interval Type the time interval for which you need to view the
performance information. Time can be specified in
Minutes, hours, days, weeks, and months.
State
Displays the state of the Fluid Cache Disk.