
Users Guide
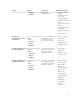
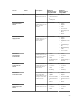

The reachable devices are displayed in a table along with their IP Address, Hostname, and Device
Type.
By default, all the reachable devices are selected. You can remove devices you do not wish to
monitor by simply clearing the check box against these devices.
2. Under Services Selection, click the required Dell device service to expand the list of associated
services.
To view all the services, click Expand All.
The services associated with the discovered hosts are listed along with parameters such as Check
Interval, Retry Interval, and Max Check Attempts with their default values. You can provide desired
values based on your monitoring requirement.
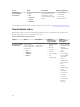
3. Click Next once you have selected the devices and services you wish to monitor.
Once the given values are accepted without errors, the Configuration Wizard: Dell OpenManage Plug-in
for Nagios XI - Step 3 page will be displayed.
If, at any point you want to change or correct any of the values you have provided in Configuration
Wizard: Dell OpenManage Plug-in for Nagios XI - Step 1, in the previous page, you can do so by clicking
the Back button.
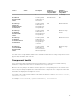
Configuration Wizard: Dell OpenManage Plug-in for
Nagios XI - Step 3
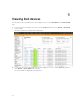
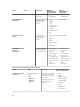
You can view the Dell devices and their associated services based on the selections you have made in
Configuration Wizard: Dell OpenManage Plug-in for Nagios XI - Step 2. These devices and services are
displayed as a collapsible list.
To view the discovery summary or details, perform the following steps:
1. Under Selected Devices, click the icon or the Dell Devices link to expand the list of discovered
devices.
The devices are displayed in a table along with their Host Address, Hostname, and Device Type.
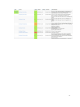
2. Under Selected Services, click the required Dell device service to expand the list of selected services.
To view all the services, click Expand All.
The services associated with the discovered hosts that you have previously selected are listed along
with parameters such as Check Interval, Retry Interval, and Max. Check Attempts with their values.
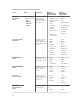
3. Click Next to further customize your monitoring requirements or click Finish to complete the
configuration process and monitor the discovered devices.
For more information about how you can further customize your monitoring requirements, see the
Nagios XI documentation at exchange.nagios.org.
If, at any point you want to change or correct any of the values you have provided in Configuration
Wizard: Dell OpenManage Plug-in for Nagios XI - Step 2, you can do so by clicking the Back button.
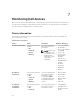
The Dell device host and its service definitions are created in the Nagios server and this is subsequently
used for monitoring the Dell devices. The discovered Dell devices and their services are displayed in the
Host Detail view and the Service Detail view in the Nagios XI Home page respectively. However, you
must wait for the scheduled service to complete for the service details to be displayed in the Nagios XI
console.
21