
Users Guide

NOTE:
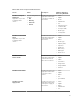
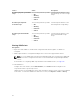
Table 23. Units and description
Unit Description
GHz Giga Hertz
W Watt
GB Giga Byte
RPM Revolutions Per Minute
A Ampere
V Volts
MB Mega Bytes
By default, the preceding services are scheduled once every four hours.
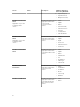
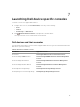
Monitoring component health status of Dell devices
To monitor the component health status of Dell devices:
1. In Nagios Core user interface, under Current Status, select Services.
2. Select the associated service to monitor the health of Dell device.
Health monitoring of Dell devices is performed through iDRAC with LC and corresponding details are
shown in their respective component health service with proper severity health color.
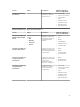
Monitor SNMP alerts
About SNMP alert monitoring
You can asynchronously receive the SNMP alerts forwarded from the devices.
Once an SNMP alert is received, the respective device’s service will display the alert summary message
and alert severity of the last recieved alert in the Nagios Core console.
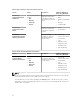
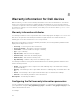
Table 24. Dell trap information
Service Status Description
Dell Server Traps The following states are possible:
• OK
• Warning
• Unknown
• Critical
Provides trap Information of the
Dell server raised through agent-
free method.
Dell Chassis Traps The following states are possible:
• OK
• Warning
• Unknown
• Critical
Provides trap Information of the
Dell M1000e, VRTX, and FX2/
FX2s Chassis.
35