
Users Guide
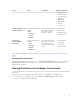


Once the discovery utility is run with the relevant option, the corresponding services are created. These
services run periodically and update the overall health of the components. The component’s status and
information are displayed in the Nagios Core user interface.
The format of the component information in the Status Information column is <Attribute>=<Value>,
<Attribute>=<Value>.
For example: Status=CRITICAL, FQDD=Fan.Embedded.1, State=Enabled
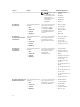
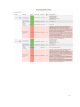
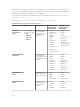
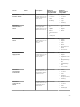
Table 18. Dell device’s component health information
Service Status Description Attributes
Displayed when
using WS-MAN
Attributes
Displayed when
using SNMP
Dell Server
Physical Disk
Status
The following
states are possible:
• OK
• Warning
• Unknown
• Critical
Provides the worst
case aggregate
health status of the
physical disks in
Dell servers.
• Status
• Fully Qualified
Device
Descriptor
(FQDD)
• State
• Product ID
• Serial No
• Size (GB)
• FirmwareVersio
n
• Media Type
• FreeSpace (GB)
• Status
• FQDD
• State
• Product ID
• Serial No
• Size (GB)
• Media Type
• FreeSpace (GB)
• FirmwareVersio
n
Dell Server Virtual
Disk Status
Provides the worst
case aggregate
health status of the
virtual disks in Dell
servers.
• Status
• FQDD
• State
• Size (GB)
• WritePolicy
• ReadPolicy
• Layout
• StripeSize
• Media Type
• Status
• FQDD
• State
• Size (GB)
• WritePolicy
• ReadPolicy
• Layout
• StripeSize
• Media Type
Dell Server Fan
Status
Provides overall
health status of the
fans in Dell servers.
• Status
• FQDD
• State
• Speed (RPM)
• Status
• FQDD
• State
• Speed (RPM)
Dell Server Battery
Status
Provides overall
health status of the
battery in Dell
servers.
• Status
• Location
• State
• Reading
• Status
• Location
• State
• Reading
28