Dell OpenManage Plug-in Version 2.
Notes, cautions, and warnings NOTE: A NOTE indicates important information that helps you make better use of your computer. CAUTION: A CAUTION indicates either potential damage to hardware or loss of data and tells you how to avoid the problem. WARNING: A WARNING indicates a potential for property damage, personal injury, or death. Copyright © 2015 Dell Inc. All rights reserved. This product is protected by U.S. and international copyright and intellectual property laws.
Contents 1 Introduction to Dell OpenManage Plug-in Version 2.0 for Nagios Core............................................................................................................................ 6 2 What is new in Dell OpenManage Plug-in version 2.0...................................7 3 Key features........................................................................................................... 9 4 Support matrix..............................................................................
Dell devices and their consoles.......................................................................................................... 37 8 Warranty information for Dell devices........................................................... 38 Warranty information attributes......................................................................................................... 38 Configuring the Dell warranty information parameters....................................................................
Configuring SNMP parameters for iDRAC using RACADM script .....................................................51 Configuring SNMP trap destination address for iDRAC using iDRAC web console......................... 51 Configuring SNMP trap destination address for iDRAC using RACADM ..........................................
1 Introduction to Dell OpenManage Plug-in Version 2.0 for Nagios Core This guide provides information about using the Dell OpenManage Plug-in Version 2.0 for Nagios Core and its various features such as discovering, monitoring, launching consoles, and troubleshooting of the supported Dell devices. The guide also provides details of the supported Dell devices and frequently asked questions by the customer. This plug-in provides capabilities to monitor Dell devices in environments managed by Nagios Core.
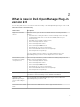
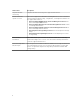
2 What is new in Dell OpenManage Plug-in version 2.0 The following table lists the new features and functionality of the Dell OpenManage Plug-in version 2.0: Table 1.
New Feature Description Trap based health monitoring Trap based health monitoring of the supported Dell devices.
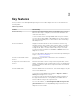
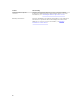
3 Key features The key features of the Dell OpenManage Plug-in Version 2.0 for Nagios Core are as described in the following table. Table 2. Key features Feature Functionality Device discovery Discovers the supported Dell devices in the Nagios Core console. Once the discovery is complete, host and service definitions are created for each device. To discover Dell Servers through iDRAC with Lifecycle Controller, you can opt for either SNMP or WS-MAN protocol.
Feature Functionality Launching device specific consoles Launches the respective Dell one-to-one consoles to further troubleshoot and manage the supported Dell devices. For more informations, see Launching Dell Device Specific Consoles. Warranty information Monitors and displays the warranty information for the supported Dell devices in a periodic manner and displays the status in the Nagios Core console. For more information, see Warranty information for Dell devices.
4 Support matrix Dell OpenManage Plug-in for Nagios Core supports the Dell devices as listed in the following tables. Dell Datacenter Scalable Solutions Table 3. Supported Dell Datacenter Scalable Solutions. Dell Datacenter Scalable Solutions (DSS) DSS 1500 DSS 1510 DSS 2500 Dell PowerEdge Servers Table 4. Supported Dell PowerEdge Servers.
th generation of PowerEdge servers 13th generation of PowerEdge servers R930 T130 T330 T430 T630 Dell Chassis Table 5. Supported Dell chassis. Dell PowerEdge FX2 Dell PowerEdge FX2s Dell PowerEdge VRTX Dell PowerEdge M1000e Dell Compellent Storage Arrays Table 6. Supported Dell Compellent Storage Arrays. Compellent Series 40 Compellent SC4020 Compellent SC8000 Dell EqualLogic PS-Series Storage Arrays Table 7. Supported Dell EqualLogic PS-Series Storage Arrays.
PowerVault MD3800f PowerVault MD3800i PowerVault MD3820f PowerVault MD3820i PowerVault MD3860f PowerVault MD3860i 13
Device discovery and inventory 5 About device discovery You can discover the supported Dell devices with this plug-in in the Nagios Core console. The monitoring protocols for the supported Dell devices are as follows: • Dell Servers are discovered using SNMP or WS-MAN protocol NOTE: At a time you can discover a Dell Server using SNMP or WS-MAN protocol and not both.
About Dell device discovery utility To run the Dell Device Discovery Utility, navigate to/dell/scripts, and run the following PERL script: perl dell_device_discovery.pl –h All the available Dell device discovery utility options are displayed. perl dell_device_discovery.pl -H | -F | -S [-P ] [-c ] [-t ] [-f] [-d] Table 9.
Options Short Description Description -d detailed services All services monitor option based on services defined in service template file. If you run the utility without this option, then the basic three services are created. For more information, see Table 3. Default services created based on selected protocol. . Based on the options you selected during discovery, the following services are associated with that host: • If you run perl dell_device_discovery.
Services SNMP WS-MAN Protocol Dell Server FC NIC Status X √ Dell Server Warranty Information √ √ Table 11.
Table 13.
About protocol parameters During discovery, depending on the protocol you have selected, SNMP or WS-MAN, you can set values for the protocol in the parameters file, .dell_device_comm_params.cfg. The .dell_device_comm_params.cfg file is present at the following location:/dell/ scripts. The options provided are: Table 15. Parameters file Protocol communication parameters Description SNMP snmp.version Use to input the SNMP version. Default version is 2. snmp.
Discovering Dell devices You can discover all the supported Dell devices using this plug-in. Prerequisites: • If you are using SNMP protocol for discovery, ensure that SNMP version 1 or SNMP version 2 are enabled, community string is set and configured for Servers or Dell Storage devices. For more information see Appendix. • A secured network connectivity is established between Nagios Core and the device. • It is recommended that the device must have a resolvable FQDN.
In the filename, pertains to the time when the log information was gathered; yyyy is the calendar year, mm is month, dd is date, hh is hour of the day, mi is minutes, and ss is seconds. After completion of discovery: • Dell device Host definition and its service definitions are created in the Nagios server and this is subsequently used for monitoring the Dell devices.
Service Dell Chassis Information Dell Storage Compellent Controller Information Dell Storage Compellent Information Status The following states are possible: • • OK Unknown • Critical • Warning The following states are possible: • • OK Unknown • Critical • Warning The following states are possible: • • OK Unknown • Critical • Warning Dell Storage EqualLogic The following states are Member Information possible: 22 • • OK Unknown • Critical • Warning Description Attributes Disp
Service Status Dell Storage EqualLogic The following states are Group Information possible: Dell Storage PowerVault MD Information • • OK Unknown • Critical • Warning The following states are possible: • • OK Unknown • Critical • Warning Description Attributes Displayed • Disk Count • Capacity (GB) • Free Space (GB) • RAID Policy • RAID Status • Group Name • Group IP • Storage Pool This service provides the • basic device inventory • information for Dell • EqualLogic Groups
2. To view the services associated with the hosts in the Nagios Core, select Services under Current Status in the left pane. The services are displayed in the right pane.
6 Monitor Dell devices You can monitor the aspects of Dell devices as explained in the following sections. Overall health status of the Dell devices You can monitor the overall health status of the Dell devices in the Nagios Core console. The overall health status is an aggregate status of the components of the supported Dell devices. About overall health status Overall health status of a device is polled periodically based on the configured interval.
Service Status Description Attributes Displayed when using WS-MAN Attributes Displayed when using SNMP • Storage Dell Chassis Overall Health Status Provides global health status of Dell chassis. Overall Chassis NA Dell Storage EqualLogic Member Overall Health Provides global health status of Dell EqualLogic Storage Arrays. NA Overall Member Dell Storage Compellent Overall Health Status Provides global health status of Dell Compellent Storage Arrays.
Once the discovery utility is run with the relevant option, the corresponding services are created. These services run periodically and update the overall health of the components. The component’s status and information are displayed in the Nagios Core user interface. The format of the component information in the Status Information column is =, =. For example: Status=CRITICAL, FQDD=Fan.Embedded.1, State=Enabled Table 18.
Service Dell Server Intrusion Status Dell Server Network Device Status Dell Server CPU Status Dell Server Power Supply Status Dell Server Temperature Probe Status Dell Server Voltage Probe Status Status Description Attributes Displayed when using WS-MAN Provides overall • health status of the • chassis intrusion in • Dell servers. • Provides the worst • case aggregate health status of the • NIC in Dell servers.
Service Dell Server Controller Status Dell Server Amperage Probe Status Dell Server SD Card Status Dell Server FC NIC Status Dell Server Warranty Information Status Description Attributes Displayed when using WS-MAN Provides the worst Not Available case aggregate health status of the storage controllers in Dell servers. Provides overall Not Available health status of the amperage probe in Dell servers. Provides overall • health status of the • SD card in Dell • servers.
Table 19. Dell chassis component health information Service Status Description Attributes Displayed when using WS-MAN Dell Chassis Physical Disk Status Applicable only to Dell PoweEdge VRTX chassis. The following states are possible: Provides the worst case aggregate health status of the physical disks in Dell chassis. • Status • FQDD • Model • PartNumber • Slot • FirmwareVersion • TotalSize (GB) Dell Chassis Virtual Disk Status Applicable only to Dell PoweEdge VRTX chassis.
Service Dell Chassis Controller Status Applicable only to Dell PoweEdge VRTX chassis. Dell Chassis Enclosure Status Applicable only to Dell PoweEdge VRTX chassis. Dell Chassis IO Module Status Dell Chassis Slot Information Dell Chassis KVM Status 32 Status Description Provides the worst case aggregate health status of the storage controllers in Dell chassis. Provides the worst case aggregate health status of the enclosure in Dell chassis.
Service Status Dell Chassis Warranty Information Description Attributes Displayed when using WS-MAN Provides warranty information status for the Dell chassis. • • • • • • • • ServiceTag Service Level Details Item number Type Ship Date (UTC) Start Date (UTC) End Date (UTC) Days Remaining Table 20.
Table 21. Dell Compellent component health information Service Status Description Dell Storage Compellent Physical Disk Status The following states are possible: Provides the worst case • aggregate health status • of the physical disks in • Dell Compellent storage arrays.
NOTE: Table 23. Units and description Unit Description GHz Giga Hertz W Watt GB Giga Byte RPM Revolutions Per Minute A Ampere V Volts MB Mega Bytes By default, the preceding services are scheduled once every four hours. Monitoring component health status of Dell devices To monitor the component health status of Dell devices: 1. In Nagios Core user interface, under Current Status, select Services. 2. Select the associated service to monitor the health of Dell device.
Service Status Description Dell Storage EqualLogic Member The following states are possible: Provides trap Information of the Dell EqualLogic PS-Series storage Traps • OK Arrays. • Warning Dell Storage Compellent Controller Traps Dell Storage PowerVault MD Traps • Unknown • Critical The following states are possible: Provides trap Information of the Dell Compellent storage Arrays.
Launching Dell device specific consoles 7 To launch console for a supported Dell device: 1. 2. In Nagios Core console, under Current Status, select any of the following: • Hosts • Services • Host Groups → Click (Perform Extra Host Actions icon) adjacent to the Dell device. The respective Dell console is launched in a new window.
Warranty information for Dell devices 8 With this feature, you can access the warranty information for the discovered Dell devices. This feature allows you to monitor the Dell device’s warranty details in the Nagios Core console. An active Internet connection is required to retrieve the warranty information. If you do not have direct internet access and are using proxy settings to access the internet, ensure that you resolve the host name api.dell.com in the etc/hosts file.
If you wish to receive a Critical warranty status notification for a discovered Dell device earlier than 10 days, which is the default value for a critical status notification , navigate to Dell_OpenManage_Plugin → resources → dell_pluginconfig.cfg file and change the default setting of this parameter from RemainingDaysCritical=10 to RemainingDaysCritical=20. NOTE: While configuring the Warranty information parameters, ensure the following: • Provide positive numeric values only.
NOTE: In case of Dell EqualLogic storage arrays, the warranty service will be associated with the EqualLogic Member IP only. In case of Dell Compellent storage arrays, the warranty service will be associated with the Compellent Controller IP only. In case of Dell PowerVault MD Storage Arrays, the warranty information will only be available for the latest firmware version.
Removing Dell devices 9 You can remove a Dell device that you do not want to monitor. 1. Navigate to /dell/config/objects, and delete the corresponding .cfg file. 2. For completing the removal of the Dell device, restart the Nagios Core services by running the following command: service nagios restart.
Knowledge Base (KB) messages for the generated alerts 10 You can get more information about the SNMP alerts generated by the discovered Dell devices from the KB messages for that device in the Nagios Core console. Viewing KB messages To view the KB messages for an SNMP alert generated by a discovered Dell device complete the following steps: 1. Log in to the Nagios Core console. 2. In the left pane, click on Services under Current Status. 3.
Troubleshooting 11 This section lists the problems that you may encounter while using the Dell OpenManage Plug-in for Nagios Core and their workarounds. Ensure that you meet the requirements, or perform the steps listed in this section. The Dell OpenManage Plug-in for Nagios Core installation script is failing 1. You have adequate permissions to run the script. Recommended: Nagios Administrator. 2. The prerequisites as mentioned in the Installation Guide are met. 3.
4. The appropriate protocol credentials are correctly configured in the following files before running a discovery: dell_resource.cfg .dell_device_comm_params.cfg 5. For an IPv6 address, ensure that the Perl Module Socket6 is installed in the same Perl library path. 6. At least one of the applicable service is enabled in the following service template: dell_server_services_template.cfg .
3. After you install SNMPTT, ensure that the Trap Integration is performed. To perform Trap Integration, from /dell/install, run the command: install.sh trap 4. Once the trap integration is complete, restart the SNMPTT service, run the command: service snmptt restart The Dell OpenManage Plug-in specific services are displaying the message, “Error while creating SNMP Session” 1. The recommended versions of Net-SNMP and Net-IP are installed.
2. The binary /libexec/eventhandlers/submit_check_result is present. 3. The trap configuration file Dell_Agent_free_Server_Traps.conf and the binary submit_check_result have appropriate permissions. Unable to monitor the RACADM specific services such as Speed(RPM), InputCurrent(A), InputVoltage(V), and OutputPower(W) for Dell chassis devices in the Nagios Core Console 1. Install RACADM. 2. Navigate to /dell/install, run the command: install.sh racadm 3.
Where do I find the OpenWSMAN distribution and its Perl binding? If the system has default Perl version (installed as part of operating system), go to “Build.opensuse.org/ package/show/Openwsman/openwsman” and download the OpenWSMAN library and its Perl binding. If you have installed a Perl version other than the default version, or the Perl binding is not available then go to “Github.com/Openwsman/openwsman” and follow the instructions to compile and use.
Frequently asked questions 1. 12 Question: Can you provide information on Licensing of Dell OpenManage Plug-in for Nagios Core? Answer: You can install and use this plug-in for free. 2. Question: What are the Dell hardware models supported by the plug-in? Answer: For the list of supported Dell platforms, see Support Matrix. 3. Question: I have earlier generation of servers (9th Generation – 11th Generation) in my data center.
you to monitor SNMP alerts generated from Dell servers and supports one-to-one iDRAC web console launch to perform further troubleshooting, configuration, and management activities. Some of the capabilities provided here are not available in other plug-ins present on Nagios Exchange. 7. Question: What are the languages supported by the plug-in? Answer: The plug-in currently supports only English language.
A Appendix Configuring SNMP parameters for iDRAC using the iDRAC web console 1. Launch the iDRAC (12th and later generation of Dell PowerEdge servers) web console and navigate to Network → Services in the console. 2. Configure the SNMP Agent properties: a. Set Enabled to True and SNMP Protocol to All (SNMP v1/v2/v3). b. Set SNMP Community Name with a community string. c. Click Apply to submit the configuration. NOTE: The Plug-in communicates with iDRAC using only SNMP v1 or SNMP v2 protocol.
• In the Alerts Filter section, select the required fields under Category and Severity. You will not receive any SNMP alerts if none of these fields are selected. • 4. In the Alerts and Remote System Log Configuration section, select the required fields thereby configuring the SNMP alerts.