
Users Guide
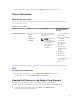
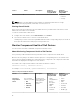
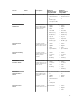
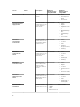
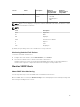

Service Status Description Attributes
Displayed when
using WS-MAN
Attributes
Displayed when
using SNMP
SD card in Dell
servers.
• InitializedState
• Size (GB)
• AvailableSpace
(GB)
NOTE: Nagios console displays a component’s status as CRITICAL in the Status Information column
when the actual status is Unknown.
NOTE:
Unit Description
GHz Giga Hertz
W Watt
GB Giga Byte
RPM Revolutions Per Minute
A Ampere
V Volts
MB Mega Bytes
By default, the preceding services are scheduled once every four hours.
Monitoring Health of Dell Devices
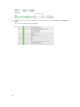
To monitor the health of Dell devices:
1. In Nagios Core user interface, under Current Status, select Services.
2. Select the associated service to monitor the health of Dell devices.
Health monitoring of servers is performed through iDRAC with LC and corresponding details are
shown in their respective component health service with proper severity health color.
Monitor SNMP Alerts
About SNMP Alert Monitoring
You can asynchronously receive the SNMP alerts forwarded from the devices.
Once an SNMP alert is received, the Dell Server Traps service will display the alert summary message and
alert severity in the Nagios Core console.
19