
Users Guide
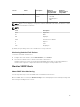

Service Status Description Attributes
Displayed when
using WS-MAN
Attributes
Displayed when
using SNMP
• Chassis
Intrusion
• Storage
NOTE: Status of Storage attribute is representative of cumulative health status of storage
components like physical disk, virtual disk, controller, and so on.
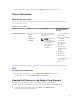
Viewing Overall Health
Before you monitor the health of the discovered Dell devices in your data center environment, ensure
that the discovered devices are reachable.
To view the overall health of Dell devices:
1. In Nagios Core user interface, under Current Status, select Services.
2. Select the associated service to view the overall health status.
Health polling of servers is done through iDRAC with LC and the corresponding objects are shown in
their respective health service with proper severity health color.
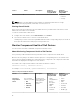
Monitor Component Health of Dell Devices
You can monitor the health of individual components in the Dell servers.
About Monitoring Component Health of Dell Devices
This is periodic poll based health monitoring of the Dell servers’ component level health status.
Once the discovery utility is run with the relevant option, the corresponding services are created. These
services run periodically and update the overall health of the components. The component’s status and
information are displayed in the Nagios Core user interface.
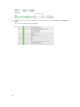
The format of the component information in the Status Information column is
<Attribute>=<Value>[, <Attribute>=<Value>].
For example: Status=CRITICAL, FQDD=Fan.Embedded.1, State=Enabled
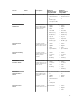
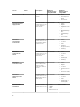
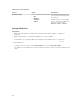
Table 7. Component health information
Service Status Description Attributes
Displayed when
using WS-MAN
Attributes
Displayed when
using SNMP
Dell Server
Physical Disk
Status
The following
states are possible:
• OK
• Warning
• Unknown
• Critical
Provides worst
case health status
of the physical
disks in Dell
servers.
• Status
• Fully Qualified
Device
Descriptor
(FQDD)
• State
• Product ID
• Serial No
• Status
• FQDD
• State
• Product ID
• Serial No
• Size (GB)
• Media Type
16