
Web Client Guide


Dashboard Views | Monitoring
281
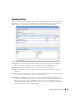
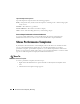
Dashboard Editor
When you
Edit
dashboard by right-clicking a resource in
Managed Resources
and selecting
Show
Performance
, or create (select
New
) a dashboard from the
Dashboard Views
portlet, an editor
appears that lets you select and rearrange the monitor components of the dashboard.
This screen has the following fields:
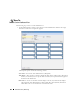
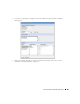
View Name
—The identifier for the dashboard. The default is “Performance dashboard for [IP
address],” but you can edit this. This is what appears in the Dashboard Views list.
Show Composites
—Show attributes that are constructed from other attributes.
TimeFrame
—Use the selectors to configure the time frame for the performance measurement
displayed.
Entities
—Select the equipment you want to monitor. When you right-click to
Show Performance
with resource(s) selected, those resources appear in this list.
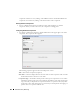
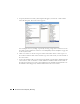
Dashboard View Attributes
—Click the arrows between
Available
and
Selected
panels to select
monitors for the dashboard. The Available Attributes list shows all the available attributes for
that device based on its monitor affiliations. If you select none, a chart appears for each
attribute that has data. This is the default. If the user moves some attributes to the
Selected
list then only charts for those attributes appear.