
Web Client Guide


Resource Monitors | Monitoring
247
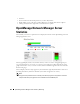
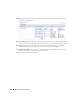
Expanded Resource Monitor
This screen appears when you click the plus in the upper right corner of the summary screen.
As in most expanded views, this one displays a list ordered by the
Name
of the monitor. Click
Settings
to configure the column display. Available columns include those on the summary screen
(
Name, Enabled, Monitor Type
) as well as
Description, Poling Interval, Target Count
and
Retention
Policy.
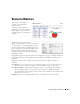
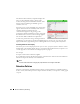
Resource Monitor Snap Panels
When you select a monitor, the Snap Panels at the bottom of the screen display details about it.
The
Reference Tree
shows the selected monitor’s connection to attributes, groups, retention
policies and its membership (the devices monitored).
The
Details
Snap Panel displays the attributes the popup shows when you hover the cursor over the
Monitor Type
column in the summary screen, and adds
Emit Availability
(events),
Retain
Availability, Retain Polled Data,
and
Retain Calculated Data
parameters.