
Users Guide


Monitoring Network Availability | Performance Monitoring
OMNM 6.5.3 User Guide 405
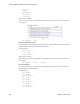
Target Summary Pattern
This pattern appears in the expanded Resource Monitors portlet when you select the monitor in
the top panel
<PolicyMapName> : <CMName> : <CfgRate>
Qos Queuing Monitor
Qos Queuing Monitor collects metrics from the cbQosQueueingStatsTable. This table specifies
Queueing Action-related statistical information.
Available Metrics
CurrentQDepth
MaxQDepth
DiscardByte
DiscardPkt
QoS Configuration Filtering Attributes
CfgBandwidth - specified in kbps or percentage
CfgBandwidthUnits - enumeration
Target Summary Pattern
This pattern appears in the expanded Resource Monitors portlet when you select the monitor in
the top panel
<PolicyMapName> : <CMName> : <CfgBandwidth>
Qos Traffic Shaping Monitor
Qos Traffic Shaping Monitor collects metrics from the cbQosTSStatsTable. This table specifies
traffic-shaping Action related statistical information.
Available Metrics
DelayedByte
DelayedPkt
DropByte
DropPkt
Active
QSize
Target Summary Pattern
This pattern appears in the expanded Resource Monitors portlet when you select the monitor in
the top panel
<PolicyMapName> : <CMName> : <TSCfgRate>
Qos RED Monitor
Qos RED Monitor collects metrics from the cbQosREDClassStatsTable. This table specifies per
Precedence WRED (wait random early detection) Action-related statistical information.
Available Metrics
RandomDropPkt
RandomDropByte
TailDropPkt
TailDropByte