
Users Guide


Understanding Performance Monitoring | Performance Monitoring
364 OMNM 6.5.3 User Guide
11
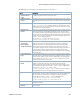
What was the result of
this polling attempt?
Was this target available and reachable? If so did data return for this attribute?
Certain error conditions result from an error occurring, including if the
connection failed or was refused or dropped or if there were bad credentials or
if there was a device fault. Some conditions result in posting an indeterminate
result, including the data context not being found within the device for the
attribute being polled.
12
Post data result
OpenManage Network Manager posts attribute data it successfully retrieves
from the target device. Once it posts this data to the application server and
stores it in the database, because data returned, the Monitor Status Summary
of the target device becomes Available (with a green checkbox icon) in most
cases.
The only exception occurs when not all requested attributes for the target
returned data. If some data returns but one or more attributes is unavailable
or not supported by the device then status of the target says Partial Results
(with a yellow triangle with an exclamation point icon).
Note that this step compiles the polling data that came from the target
device, it does not post the returned data to the application server nor store it
to the database, but it does identify the polling results as successful, as
opposed to error or indeterminate.
13
Post error result
If an error occurred during the attempt to poll the target then OpenManage
Network Manager posts information about the error. Possible causes:
connection to the target failed, was refused, or was dropped, bad credentials,
or another device fault. Once OpenManage Network Manager posts the error
information to the application server and stores it in the database, the
Monitor Status Summary of the target device becomes Not Available (with a
red “X” icon). Note that this step exists only to take note of the errors that
occurred during the last polling attempt. Like step 12, this step does not post
any data to the application server nor store it to the database, but simply
compiles the results of the last polling attempt.
14
Post indeterminate
result
Sometimes the attempt to poll the target device is indeterminate. In such
situations, neither an error occurred, nor did any data return from the target.
If OpenManage Network Manager did not find the data context on the target
device for this attribute, or a timeout occurred while trying to reach the
device, this can occur. Once OpenManage Network Manager posts the
indeterminate information to the application server and stores it in the
database, the Monitor Status Summary of the target device becomes Not
Applicable (with a gray question mark icon). Like step 12, this step does not
post any data to the application server nor store it to the database, but simply
compiles the results of the last polling attempt.
15
Did the attribute to
cross a severity
threshold or condition
because of the new
data?
Each attribute can have one or more severity thresholds and/or conditions. For
example if the CPU usage exceeds 95% then its attribute might be at a critical
severity level. If an attribute was previously within a certain severity level and
the new polling results show that this attribute crossed the threshold into
another severity level (for example minor to major or major to critical) then it
meets this condition. If new polling results show that this attribute remained
in the same severity level (for example, it was critical and remains critical at
least for the moment), then it does not meet this condition.
16
Emit Monitor
Attribute Trend Event
OpenManage Network Manager emits a monitorAttributeTrend Event. Go to
step
1. RC internal trap occurred
of the Understanding Event Life Cycle
diagram.
Process Description