
Users Guide


Understanding Performance Monitoring | Performance Monitoring
OMNM 6.5.3 User Guide 361
Understanding Performance Monitoring
This chapter contains the following step-by-step instructions for these features:
•
Create a Server Status Monitor Dashboard
•
Create an SNMP Interface Monitor
•
Create an ICMP Monitor
•
Create a Key Metrics Monitor
•
Create an Adaptive CLI Monitor
•
Create a Monitor for an External Script
•
Create a Monitor Report
•
Create a Simple Dashboard View
•
Create A Performance Template
You can see Performance Options from a variety of locations by right-clicking in OpenManage
Network Manager. For example:
• Ports in the Ports portlet
•Interfaces
• Ports/Interfaces in the Details panels lets you
Show Performance
• Right-clicking on any of the above within a Reference tree lets you select Performance
Options.
• All
Top N [Assets]
portlets let you right-click for Performance options.
Monitors do not directly
monitor string
attributes, but you can create an extractive Adaptive CLI
monitor that responds to string values in devices. See
Example 5: Monitor Text Values
on page 602
for an example.
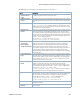
Diagram 1
and
Diagram 2
illustrate the OpenManage Network Manager (OMNM) performance
monitoring life cycle
processes.