
Users Guide


Presentation Portlets and Editors | Presentation Capabilities
244 OMNM 6.5.3 User Guide
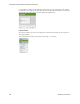
Topology and View Configuration
Click and drag displayed portions of this view to see other topology parts. To move the display
more, click in the
Overview Panel
. You can also expand/collapse the panels on the left of the screen
by clicking their title bars. (Figures below display them expanded.)
Nodes appear colored according to the alarm severity on the device, and white if no alarm exists for
the device. Hover the cursor over an icon or link between icons to see a small screen describing its
device (
Name, Type, IP address
), network status (
Responding/Not Responding
) and alarm severity.
Click an icon to highlight it (or click its name in the
Top-Level Nodes Tab
list) and its connections
to the network. See
Alarms in Topologies
on page 251 for more about the alarm severities
indicated by icons in topology.
Click the
Legend Tab
to see the lines meaning, links, and alarm colors. Hover the cursor over a link
to see its type described.
The
topology toolbar
helps navigate through the topology, load a view, save a view, and so on.
Add tool open the Add a Graph Element window where you select the element type
(Label, Cloud, or Linked View) and whether it is a static placement.
Use the Properties panel to configure the font, background color, label contents, and
so on, after you select the added element.
Note: If you configure and save a Drill-in view with the design tools, then that view
persists for all drill-ins from that device until you remove it an icon that appears
between view Open and Save when it is enabled. Deleting such a drill-in view
restores the default settings.
When you add these elements, you can elect to check Static Placement and they will
not move with graphic elements when they are automatically re-arranged. You can,
however, click and drag them.
Tool Description