
Users Guide


Resource Management Portlets and Editors | Resource Management
194 OMNM 6.5.3 User Guide
The
Quick Actions
panel in the General tab also displays icons that activate direct access or the
resource editor.
Direct access includes
Terminal
,
MIB Browser
,
Ping (ICMP)
or
HTTP/HTTPS
).
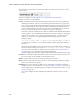
Click the tab name to see the following:
General
–In addition to Quick Action icons, this displays details about the selected equipment,
including its Domain ID. This screen also includes performance indicators to report on the
device’s CPU, memory and disk utilization (flash memory) both currently and for the last 30
minutes (click the links above the panel), a Monitor Status Summary, and Reference Tree,
and a list of the Authentications connected to the device. If disk utilization is less than one
percent, an indication that the device is still active may appear in that graph.
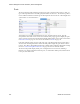
Permissions control the visibility of some attributes. Information like IOS/Firmware/Software
versions appears to users only if they have READ permission for these attributes. To configure
attributes as not viewable—one example: management IP address—you must define the
attribute set and add it to owareapps\installprops\lib\installed.properties file as in the
following example:
restricted.attribute.names.set1=RedCell.Config.EquipmentManager_IPAddress
For each restricted attribute set, you can define multiple attributes with comma delimited
DSI names.
After defining such attributes, in the permission manager, uncheck the READ permission on
roles that you do not wish to have access to
Restricted Attribute Access 1
. You can
conceal up to five such attributes. Attribute names are similar to the
Using Email Action
Variables
on page 318, at least when fully qualified with the prefix
Redcell.Config.EquipmentManager. Contact technical support for identifiers not listed there.
Network–
This screen lists the Ports and Interfaces for the selected device (some devices have one,
but not the other), VLANs and links associated with the device.
Alarms
–Displays the alarms and events associated with the selected device.
History
–Includes audit trails connected to the device, and any backed up configurations. Right-
click to view or otherwise act on these.
Performance
–This screen contains two links at its top. One displays a performance dashboard
(template) related to the selected device. See
Show Performance Templates
on page 435 for
how to configure these. The other displays any configured
Top Ta lkers
for the device. See
Top
N [Assets]
on page 422.
You can also configure the interval displayed by clicking the clock icon at the top of this
screen.