
Users Guide


Managing Virtualized Network Functions | Virtualization Management
OMNM 6.5.3 User Guide 1009
3
Acknowledge those alarms that you plan to address.
Address alarms from the most sever state to the least sever state (Critical, Major, Minor, and
War ning) .
4
Address alarm issues appropriately.
Viewing Managed Resources Performance
A managed resource’s Performance Dashboard shows patterns for CPU and memory utilization,
packet counts, RTT (round-trip time) measurements, and so on.
Viewing VIM Details
on page
1012 also shows resource usage (memory, CPU, and disk). For a detailed description of this portlet
and its options, see
Performance Dashboard
on page 428.
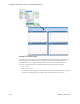
View a managed resource’s performance from the Managed Resources portlet as follows.
1
Select a resource.
2
Right-click > Performance > Show Performance.
The Performance Dashboard displays data patterns based on the defined properties, entities,
and view attributes defined.