
Owner's Manual


Alarms 807
The data that appears is based on the monitors that are monitoring that device and where
Retain Data is checked. If you have several monitors and you are retaining data on those
monitors, the screen reflects those data points.
If you select two devices in Resources manager and click action -> Show performance,
OpenManage Network Manager displays both of the devices’ common attributes in the form.
(You cannot display interface data because the devices do not have interfaces in common.)
-
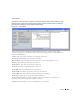
Event Management
—This menu lets you see Customers or Services related to the selected
Alarm.
Figure 33-5. Event Management
Selecting these menu items displays the a filtered Customer or Service man-
ager. If the alarm is unrelated to customers or services, a No impacted entities
were found for the selected alarm(s) message appears.
NOTE:
If a related entity exists, a reminder of the source alarm appears in the title bar of the manager that
appears with the related customer /service.
-
Help
—Select this option to open online help for this screen.
NOTE:
You can automate responses to alarms with Event Processing rules. For example, an alarm can trigger an
e-mail. See Event Processing Rules on page 815.
Alarm Table Columns
The following describes the columns that appear in the Alarm table. You can use any or all of the
attribute columns in a view, and you can use all attribute columns (except as noted). You can alter
the view by dragging the column headers up to delete a column, or by clicking the plus (+) at the
top right of the manager and selecting column names, then clicking
Add Column
. Added columns
appear to the right of those already there. The following are the attribute columns, in alphabetic
order following the default columns: