
Owner's Manual


Active Performance Monitor 793
Click the device in the upper portion of the screen to display its key metrics in the bottom portion
of the screen. Click the
Selected
checkbox to begin monitoring the Key Metrics for the selected
device. You can alter the monitoring interval globally in the upper
Default Collection Interval
.
Click
Edit
in the lower portion of the screen to alter the interval for individual metrics with the
Collection Interval
fields at the bottom of the
Key Metrics
panel. Click
Apply
to accept any interval
edits, or
Cancel
to abandon such edits. As with basic Key Metrics, click the
Graph
button in the
lower right panel to see a graph of all selected devices’ Key Metrics combined.
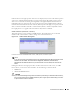
SNMP Attributes (Interfaces or Scalars)
This panel appears if you are creating an SNMP monitor. The application stores not absolute
numbers from counters but the counter’s change since its last measurement.
Figure 32-21. SNMP Attribute Management
Columns include the SNMP Attribute
Name, OID, Syntax,
and
Meta Syntax.
NOTE:
If you check the Collect from ifXTable checkbox, then OpenManage Network Manager attempts to fetch
attributes from the ifXTable. These attributes are ifHighSpeed, ifHCInOctets, ifHCInUcastPkts,
ifHCOutOctets and ifHCOutUcastPkts. If any of these attributes are not available, then it fetches from
ifTable.
Clicking the buttons to the right opens either an editor at the bottom of the screen, or a MIB
browser where you can retrieve these attributes. See the following sections for details.
•MIB Browser
• Add / Edit SNMP Attributes
CAUTION:
If you receive the following message: Device fault: Return packet too big. in the Monitor Status Summary,
then you have selected too many SNMP attributes to poll in a single request. Please modify your monitor
to request smaller numbers of attributes