
Owner's Manual


792 Active Performance Monitor
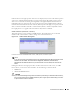
performance in real time. Graphing begins when you click this button. Leave the graph open to
watch its progress (you can perform other tasks on other application screens while this one is open
too).
If you click multiple attributes, the graph may appear with multiple indexes (on the left).
Composite attributes graph multiple lines, one for each of their components. Click
Settings
to
return to the settings screen.
Key Metrics for Multiple Devices
In addition to configuring Key Metrics monitors, as described in Creating or Updating a Monitor
on page 771, OpenManage Network Manager lets you select multiple devices in Resources,
Topology or Chassis View, and use the action menu to select
Key Metrics
for those devices
.
This
opens a screen where you can configure which key metrics to monitor for the selected devices.
OpenManage Network Manager assumes group targets represent the corresponding top level
managed objects. Subcomponent support in Key Metrics monitor is only for explicitly configured
subcomponent targets.
Figure 32-20. Key Metrics for Multiple Devices