
Users Guide


Viewing dashboards
Dashboards enable you to monitor and analyze the Dell EMC PowerEdge servers and chassis environment in vROPS.
The following dashboards are available in vRealize Operations Manager:
• Dell EMC Servers Overview Dashboard
• Dell EMC Server Detailed Dashboard
• Dell EMC Chassis Overview Dashboard
• Dell EMC Chassis Detailed Dashboard
Dell EMC servers overview dashboard
Following are the parameters displayed in the Dell EMC Servers Overview Dashboard:
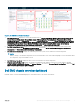
Figure 1. Dell EMC Servers Overview Dashboard
1 Dell EMC Servers Environmental Health: Displays the health status of all the servers. Red indicates Critical state, yellow indicates
Warning state, and green indicates Healthy state. The source of Dell EMC Servers Environmental Health is dened as Server
Metrics|Server Overall Health (Enum).
NOTE
: Health status is reported based on polling, SNMP Trap (External Alerts) does not impact this heatmap.
2 Dell EMC Servers Top Alerts: Displays the top 15 alerts of PowerEdge servers. The source of Dell EMC Servers Top Alerts is dened
as Dell EMC Servers Group.
3 Dell EMC Server Warranty Heatmap: Displays the warranty status of all the servers. Red indicates Critical state, yellow indicates
Warning state, and green indicates Healthy state. OpenManage Management pack creates a warning or critical alert based on the
OpenManage Management Pack for vRealize Operations Manager
7