OpenManage Management Pack for vRealize Operations Manager version 1.
Messaggi di N.B., Attenzione e Avvertenza N.B.: un messaggio N.B. (Nota Bene) indica informazioni importanti che contribuiscono a migliorare l'utilizzo del prodotto. ATTENZIONE: Un messaggio di ATTENZIONE indica un danno potenziale all'hardware o la perdita di dati, e spiega come evitare il problema. AVVERTENZA: Un messaggio di AVVERTENZA indica un rischio di danni materiali, lesioni personali o morte. © 2016 - 2018 Dell Inc. o sue affiliate. Tutti i diritti riservati.
Contents 1 OpenManage Management Pack for vRealize Operations Manager................................................................4 What is new in this release................................................................................................................................................4 Use case scenarios............................................................................................................................................................ 5 Monitoring the servers.....
1 OpenManage Management Pack for vRealize Operations Manager OpenManage Management Pack for vRealize Operations Manager enables monitoring of different metrics and hardware resources in the PowerEdge server (12th generation of PowerEdge servers and later) and chassis by using vRealize Operations Manager. OpenManage Management Pack for vRealize Operations Manager requires VMware vRealize Operations Manager version 6.5 or later.
• Addition of Cluster Metrics in Dell Firmware Report • Introduces SSD write endurance report • Support for vROPS 6.
SNMP Trap Monitoring Prior to this 1.2 release, OpenManage Management Pack for vRealize Operations Manager used to collect the metrics of the PowerEdge server and the related Chassis at regular intervals (by default 5 minutes) from OMIVV. OMIVV polls the health metrics and extended metrics of the PowerEdge servers and it’s associated Chassis every 1 hour and every 2 hours respectively.
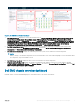
Viewing dashboards Dashboards enable you to monitor and analyze the Dell EMC PowerEdge servers and chassis environment in vROPS. The following dashboards are available in vRealize Operations Manager: • Dell EMC Servers Overview Dashboard • Dell EMC Server Detailed Dashboard • Dell EMC Chassis Overview Dashboard • Dell EMC Chassis Detailed Dashboard Dell EMC servers overview dashboard Following are the parameters displayed in the Dell EMC Servers Overview Dashboard: Figure 1.
Expiration Notification Threshold set at OMIVV. The critical threshold values can have 4 different values: 15 Days, 30 Days, 45 Days and 60 Days. The warning threshold values can have 3 different values: 90 Days, 120 Days and 150 Days. The source of Dell EMC Servers Warranty Heatmap is defined as Server Metrics|Overall Warranty Status(Enum). NOTE: No health status is reported if Warranty Notification Threshold is disabled at OMIVV or warranty is not collected for the server.
Figure 2. Dell EMC Server Detailed Dashboard 1 Dell EMC Server List: Displays the servers and the details such as, Server Rollup Status, Memory Rollup Status, Battery Rollup Status, Processor Rollup Status, Voltage Rollup Status, PSU Rollup Status, Fan Rollup Status, Temperature Rollup Status, Storage Rollup Status, and Proactive HA.
Figure 3. Dell EMC Chassis Overview Dashboard 1 Dell EMC Chassis Environmental Health: Displays the health status of all the chassis. Red indicates the critical state, yellow indicates warning state, and green indicates healthy state. Health status is reported based on polling alone, SNMP Trap (External Alerts) does not impact this heatmap. The source of Dell EMC Chassis Environmental Health is defined as Chassis Metrics|Chassis OverAll Health(Enum).
Figure 4. Dell EMC chassis detailed dashboard 1 Dell EMC Chassis List: Displays the chassis and the details such as, Hostname, Model, ServiceTag, IPAddress, Chassis Overall health, PSU Rollup Status, and Fan Rollup Status. The source of Dell EMC Chasssi List is defined as Chassis Metrics|Model, Chassis Metrics|Host Name, Chassis Metrics|IpAddress, Chassis Metrics|Service Tag, Chassis Metrics|Chassis Overall Health, Chassis Metrics|PSU Rollup Status, and Chassis Metrics|Fan Rollup Status.
4 In Environment Overview, select Dell EMC Servers. 5 Select the server that you want view, and then select the Details tab. A List of views is displayed. Accessing views for the group of servers Perform the following steps to access Dell server group views for all the servers: 1 Launch vRealize Operations Manager for a console. 2 Click Environment. 3 Expand All Objects, and click Dell OpenManage Adapter.
3 Click Run Template and select All Objects > Dell EMC OpenManage Adapter > Dell EMC Server Group > Dell Server Group. 4 Click OK. Dell EMC Chassis Warranty Dell EMC server warranty displays Name, Days Left, End Date, Entitlement Type, Provider, Service Level Description, Start Date, Last Updated Time and Status of Dell EMC Chassis. Perform the following steps to access Dell EMC chassis warranty: 1 On the Dashboards tab, click Reports. 2 Select Dell EMC Chassis Warranty.
3 Click Run Template and select All Objects > Dell EMC OpenManage Adapter > Dell EMC Servers Group > Dell Servers Group. 4 Click OK. NOTE: You can see a heat map of the Server Warranty in the Dell EMC Server Overview dashboard. Viewing alerts OpenManage Management Pack for vRealize Operations Manager displays any events from the Dell EMC servers, chassis and associated components as alerts. It also recommends that you perform certain steps to overcome the unusual events.
2 License metrics of OMIVV To access the license metrics of OMIVV: Click Environment > All objects > Dell EMC OpenManage Adapter > Dell EMC OpenManage Adapter Instance > Select Instance > All metrics > License Info. The license for OMIVV is also the licensing used for the management pack. License metrics of OMIVV enables you to view the license information and metrics. The following metrics are associated with Dell OMIVV License: • Available Nodes: Displays the number of licenses that are available.
3 Dell EMC server metrics To access Dell EMC server metrics: Click Environment > All objects > Dell EMC OpenManage Adapter > Dell EMC server > Select Server > All Metrics. Table 1.
Voltage Rollup Status vCenter Server NOTE: The vCenter metric for the server can either be the vCenter FQDN or its IP when the vCenter is registered with OMIVV using its hostname.
Service Level Description Start Date Status Dell EMC Server Temperature Sensor Metrics Current Reading (Fahrenheit) Current Reading(Celsius) Health Status Maximum Critical Threshold (Fahrenheit) Maximum Critical Threshold (Celsius) Maximum Warning Threshold (Fahrenheit) Maximum Warning Threshold(Celsius) Minimum Critical Threshold (Fahrenheit) Minimum Critical Threshold(Celsius) Minimum Warning Threshold (Fahrenheit) Minimum Warning Threshold(Celsius) NOTE: Whenever the Temperature Probes values are not ap
Input Voltage (Volts) Redundancy Status NOTE: Power supply redundancy status is displayed as Unknown, if the Redundancy Policy is set to Not Redundant in Integrated Dell EMC Remote Access Controller (iDRAC).
UEFI Support Vendor Dell EMC Server Controller Metrics Controller Mode FQDD Health Status Max Capable Speed Product Name SAS Address Dell EMC Server FC Metrics FC Boot Support FQDD Invalid CRCs Link Failures Link Speed Link Status Loss of Signals On Chip Thermal Sensor OS Driver State Rx KB Count Tx KB Count UEFI Support Vendor Name Virtual World Wide Node Name (VWWN) Virtual World Wide Port Name(VWWPN) World Wide Node Name(WWN) World Wide Port Name(WWPN) 20 Dell EMC server metrics
4 Dell EMC chassis metrics To access Dell EMC chassis metrics: Click Environment > All objects > Dell EMC OpenManage Adapter > Dell EMC chassis > Select chassis > All Metrics > chassis Metrics. Table 2.
Status Dell Chassis PSU Metrics Health Status Input Voltage (Volts) Dell Chassis Fan Metrics Health Status Current Reading (RPM) 22 Dell EMC chassis metrics
5 View DellEMC PowerEdge servers and ESXi of VMware relationship This dashboard provides a visual representation of server relationship between DellEMC PowerEdge servers and ESXi. NOTE: Admin can see server and ESXI relationship only when the OMIVV managed vCenter is added to vROPS. To view the object relationship health tree, see Dell EMC server detailed dashboard.
6 Known Issues • Historical data for HDDs are not available after the OpenManage Management Pack for vRealize Operations Manager Version 1.1 upgrade. This is an expected behavior, with the latest upgrade, adapter is offering HDD and SSD data separately. However, historical data are available only for the SSDs. HDD metrics are freshly populated since the time adapter has been updated. • After OpenManage Management Pack for vRealize Operations Manager Version 1.
7 Accessing documents from the Dell EMC support site You can access the required documents using the following links: • For Dell EMC Enterprise Systems Management documents — Dell.com/SoftwareSecurityManuals • For Dell EMC OpenManage documents — Dell.com/OpenManageManuals • For Dell EMC Remote Enterprise Systems Management documents — Dell.com/esmmanuals • For iDRAC and Dell EMC Lifecycle Controller documents — Dell.