
Users Guide
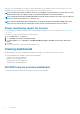
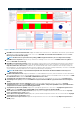
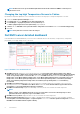
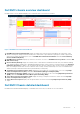
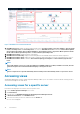
Table Of Contents
- OpenManage Management Pack for vRealize Operations Manager version 1.2 User’s Guide
- Introduction
- License metrics of OMIVV
- Dell EMC Server metrics
- Dell EMC chassis metrics
- View DellEMC PowerEdge servers and ESXi of VMware relationship
- Known Issues
- Accessing documents from the Dell EMC support site

metric poll on the corresponding server/chassis so that the updated metrics are available to vROPS on the next collect cycle. These
updated metrics lead to the generation of an internal alert for the corresponding component.
NOTE: Cancel the alerts when you address the issues corresponding to any specific alert. In case, the alert is not clear
and if the same event occurs again, you may see an older timestamp that is associated to that alert.
NOTE: Identify the external alert using Dell Alert with message ID. The alert format is: Dell EMC <Server/Chassis>
<Critical/Warning/Information>- [Message ID].
NOTE: The basic health update and extended metric jobs may fail to run within a minute when multiple traps for the
same server are received. The associated metrics for the server are refreshed after the next successful run.
Power monitoring report for servers
Power Monitoring report displays the server metrics for the Dell EMC PowerEdge servers. For more information, see Dell EMC Server
Power Details.
Perform the following steps to generate power monitoring report:
1. On the Dashboards tab, click Reports.
2. Select Dell EMC Server Power Consumption Report.
3. Click Run Template and select All Objects →Dell EMC OpenManage Adapter→Dell EMC Servers Group →Dell Servers
Group.
4. Click OK.
Power monitoring reports are generated for all Dell EMC servers.
Viewing dashboards
Dashboards enable you to monitor and analyze the Dell EMC PowerEdge servers and chassis environment in vROPS.
The following dashboards are available in vRealize Operations Manager:
• Dell EMC Servers Overview Dashboard
• Dell EMC Server Detailed Dashboard
• Dell EMC Chassis Overview Dashboard
• Dell EMC Chassis Detailed Dashboard
Dell EMC servers overview dashboard
Following are the parameters displayed in the Dell EMC Servers Overview Dashboard:
6
Introduction