
Users Guide
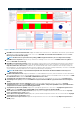
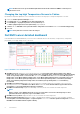
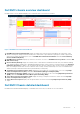
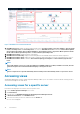
Table Of Contents
- OpenManage Management Pack for vRealize Operations Manager version 1.2 User’s Guide
- Introduction
- License metrics of OMIVV
- Dell EMC Server metrics
- Dell EMC chassis metrics
- View DellEMC PowerEdge servers and ESXi of VMware relationship
- Known Issues
- Accessing documents from the Dell EMC support site

Monitoring the servers
Server monitoring is the process of reviewing and analyzing a server for health, inventory, availability, and other operations-related
processes. You can also monitor the components of servers such as CPU, memory, PSU, fan, temperature, physical disks, and so on.
For more information, see the Dell EMC servers overview dashboard.
Perform the following steps to monitor a server:
1. Launch the vRealize Operations Manager console.
2. From the Home tab, click Environment.
3. In Environment Overview, select Dell EMC OpenManage vRealize Operations Management Pack and click Dell EMC Servers.
4. Select the server that you want to monitor.
The health status, alerts, and the associated details of the selected server is displayed. For more information about alerts, see Viewing
Alerts.
NOTE: NIC and FC does not support health monitoring, hence health is always shown as healthy.
Monitoring the chassis
Chassis monitoring is the process of reviewing and analyzing chassis level health, inventory, and availability of supported chassis
connected through OMIVV. You can monitor overall chassis health along with PSU and Fan’s health.
For more information, see the Dell EMC chassis overview dashboard.
Perform the following steps to monitor a chassis:
1. Launch the vRealize Operations Manager console.
2. On the Home tab, click Environment.
3. In Environment Overview, select Dell EMC OpenManage vRealize Operations Management Pack and click Dell EMC Chassis.
4. Select the chassis that you want to monitor.
The health status, alerts, and the associated details of the selected chassis is displayed. For more information about alerts, see Viewing
Alerts.
NOTE:
If the PowerEdge FX2 chassis is not on the network, and the RSM mode is enabled in Chassis Management
Controller, then the chassis overall health alerts are not generated on the server.
Firmware update report for Servers
Firmware update report displays the current and available versions of the firmware for each component of Servers.
Perform the following steps to generate firmware update report:
1. On the Dashboards tab, click Reports.
2. Select Dell EMC Server Firmware Update Summary Report.
3. Click Run Template and select All Objects → Dell EMC OpenManage Adapter → Dell EMC Firmware Group → Dell Firmware
Group .
4. Click OK.
Firmware update reports are generated for all Dell EMC Servers.
SNMP Trap Monitoring
Before 1.2 release, vROPS collects the metrics of the PowerEdge server and the related Chassis at regular intervals (by default 5 minutes)
from OMIVV. OMIVV polls the health metrics and extended metrics of the PowerEdge servers and the associated Chassis every one or
two hours. Due to this time gap, any health fault in the PowerEdge server and the Chassis, reflects only after a poll is completed. This
process takes more than two hours.
To reduce the time to receive, alert notifications in vROPS, OpenManage Management Pack for vRealize Operations Manager version 1.2
started synchronous monitoring for the PowerEdge servers and chassis using SNMP alerts. To ensure this functionality, enable the SNMP
Traps in iDRAC , CMC, or OpenManage Enterprise Modular edition (OME-M, used with MX7000 chassis) for the required alerts. You can
also enable or disable this feature by enabling or disabling SNMP Monitoring at OMIVV Admin portal.
Due to this newly introduced functionality, a synchronous alert is raised in vROPS when an SNMP trap based event is forward by OMIVV.
This alert is always associated with the corresponding server/chassis from which the trap is generated. OMIVV also triggers a health
Introduction
5