OpenManage Management Pack for vRealize Operations Manager version 1.
Notes, cautions, and warnings NOTE: A NOTE indicates important information that helps you make better use of your product. CAUTION: A CAUTION indicates either potential damage to hardware or loss of data and tells you how to avoid the problem. WARNING: A WARNING indicates a potential for property damage, personal injury, or death. Copyright © 2017 Dell Inc. or its subsidiaries. All rights reserved. Dell, EMC, and other trademarks are trademarks of Dell Inc. or its subsidiaries.
Contents 1 OpenManage Management Pack for vRealize Operations Manager................................. 4 What's new in this release.................................................................................................................................................. 4 Use case scenarios............................................................................................................................................................. 4 Monitoring the servers................................
1 OpenManage Management Pack for vRealize Operations Manager OpenManage Management Pack for vRealize Operations Manager enables monitoring of different metrics and hardware resources in the Dell server (12th generation servers and later) and chassis by using vRealize Operations Manager. OpenManage Management Pack for vRealize Operations Manager requires VMware vRealize Operations Manager version 6.3 or later.
Perform the following steps to monitor a server: 1. Launch the vRealize Operations Manager console. 2. From the Home tab, click Environment. 3. In Inventory Trees, select Dell Servers. 4. Select the server that you want to monitor. The health status, alerts, and the associated details of the selected server is displayed.
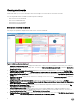
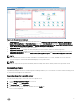
Viewing dashboards Dashboards enable you to monitor and analyze the Dell PowerEdge servers and chassis environment in vROPS. The following dashboards are available in vRealize Operations Manager: • • • • Dell Servers Overview Dashboard Dell Server Detailed Dashboard Dell Chassis Overview Dashboard Dell Chassis Detailed Dashboard Dell servers overview dashboard Following are the parameters displayed in the Dell Servers Overview Dashboard: Figure 1. Dell Servers Overview Dashboard 1.
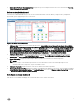
9. Select Above For Power Consumption Trend: Displays the power consumption trend for the server selected in the Top High Power Consuming Servers (watt) widget. Dell server detailed dashboard In the Dell server detailed dashboard, you can view the overall health status of the fan, battery, voltage, memory, temperature, physical disk, power supply, and processor of the server. Figure 2. Dell Server Detailed Dashboard 1.
Figure 3. Dell Chassis Overview Dashboard 1. Dell Chassis Environmental Health: Displays the health status of all the chassis. Red indicates the critical state, yellow indicates warning state, and green indicates healthy state. The source of Dell Chassis Environmental Health is defined as Dell Chassis|Badge|Health State. 2. Dell Chassis Top Alerts: Displays top 15 alerts of the chassis. The source of Dell Chassis Top Alerts is defined as Dell Chassis Group. 3.
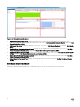
Figure 4. Dell Chassis Detailed Dashboard 1. Dell Chassis List: Displays the chassis and the details such as, Hostname, Model, ServiceTag, IPAddress, Chassis Overall health, PSU Rollup Status, and Fan Rollup Status. The source of Dell Chasssi List is defined as Chassis Metrics|Model, Chassis Metrics|Host Name, Chassis Metrics|IpAddress, Chassis Metrics|Service Tag, Chassis Metrics|Chassis Overall Health, Chassis Metrics|PSU Rollup Status, and Chassis Metrics|Fan Rollup Status. 2.
Accessing views for the group of servers Perform the following steps to access Dell server group views for all the servers: 1. Launch vRealize Operations Manager for a console. 2. On the Home tab, click Environment. 3. Expand All Objects, and click Dell OpenManage Adapter. 4. Expand Dell Servers Group, again click Dell Servers Group, and then select the Details tab. A List of views is displayed.
1. Critical - Indicates that the component has either failed or failure is imminent. It requires immediate attention and may require replacement. 2. Warning - Indicates that a probe or other monitoring device has detected a reading for the component that is exceeding the acceptable level. The component may be functioning, but it can fail. The component may also be functioning in an impaired state.
2 License metrics of OMIVV The license for OMIVV directly interprets to the licensing used for the management pack. License metrics of OMIVV enables you to view the license information and metrics. The following metrics are associated with Dell OMIVV License: • Available Nodes: Displays the number of licenses that are available. • Used Nodes: Displays the number of licenses that are used. • Evaluation License: Displays the current license type whether or not it is evaluation or standard license.
3 Dell server metrics Table 1.
FRM Enable FRM Type Peak Amps End Date Time Peak Amps Start Date Time System Board Power Consumption (Watt) System Instantaneous Headroom (Watt) System Peak Amps System Peak Headroom (Watt) System Peak Power End Date Time System Peak Power Start Date Time System Peak Power (Watt) Warning Threshold (Watt) Server Firmware Updates Critical Firmware Metrics Collection Job Status Optional Recommended Server Warranty Days Left End Date Entitlement Type Last Updated Time Provider Service Level Description Start
Dell Server System Board Inlet Temperature Sensor Metrics Current Reading (Fahrenheit) Health Status Maximum Critical Threshold (Fahrenheit) Maximum Warning Threshold (Fahrenheit) Minimum Critical Threshold (Fahrenheit) Minimum Warning Threshold (Fahrenheit) Dell Server PSU Metrics Health Status Input Voltage (Volts) Redundancy Status NOTE: Power supply redundancy status is displayed as Unknown, if the Redundancy Policy is set to Not Redundant in Integrated Dell Remote Access Controller (iDRAC).
4 Dell chassis metrics Table 2. Dell Chassis Metrics Resources Available Chassis- Resource Metrics Chassis Metrics Chassis Overall Health Enegy Consumption (KWh) Fan Rollup Status Host Name IPAddress Model Overall Warranty Status PSU Rollup Status Service Tag System Peak Power End Date Time System Peak Power Start Date Time System Peak Power (Watt) NOTE: When rack server Mode is enabled, chassis PSU and fans are discovered and monitored as server components.
Current Reading (RPM) 17
5 View Dell PowerEdge servers and ESXi of VMware relationship This dashboard provides a visual representation of server relationship between Dell PowerEdge servers and ESXi. To view the object relationship health tree, see Dell server detailed dashboard.
6 Issues • Servers that have an in-built PSU or the drives that are connected to Embedded Controller always display a warning status in vROPS, because Embedded Controller is not monitored by iDRAC. • The removed PSUs or fans exist under Dell chassis. In such a situation, because the health cannot be retrieved the FAN or PSU status is displayed as Critical.
7 Accessing documents from Dell support site You can access the required documents in one of the following ways: • Using the following links: – For all Enterprise Systems Management documents — Dell.com/SoftwareSecurityManuals – For OpenManage documents — Dell.com/OpenManageManuals – For Remote Enterprise Systems Management documents — Dell.com/esmmanuals – For iDRAC and Lifecycle Controller documents — Dell.com/idracmanuals – For OpenManage Connections Enterprise Systems Management documents — Dell.