
Users Guide
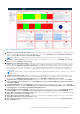
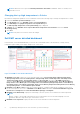
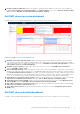
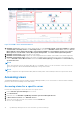
Table Of Contents
- OpenManage Management Pack for vRealize Operations Manager version 1.2 User’s Guide
- Contents
- OpenManage Management Pack for vRealize Operations Manager
- License metrics of OMIVV
- Dell EMC server metrics
- Dell EMC chassis metrics
- View DellEMC PowerEdge servers and ESXi of VMware relationship
- Known Issues
- Accessing documents from the Dell EMC support site

SNMP Trap Monitoring
Prior to this 1.2 release, OpenManage Management Pack for vRealize Operations Manager used to collect the metrics of the
PowerEdge server and the related Chassis at regular intervals (by default 5 minutes) from OMIVV. OMIVV polls the health
metrics and extended metrics of the PowerEdge servers and it’s associated Chassis every 1 hour and every 2 hours respectively.
Due to this time gap, any health faults in the PowerEdge server and it’s Chassis reflects only after a poll is getting completed, it
may take more than 2 hours.
In order to reduce the time to receive alert notification in vROPS, OpenManage Management Pack for vRealize Operations
Manager version 1.2 has started synchronous monitoring for the PowerEdge servers and chassis using SNMP alerts. To ensure
this functionality, you must enable the SNMP Traps in iDRAC or CMC for the required alerts. You can also enable or disable this
feature by enabling or disabling SNMP Monitoring at OMIVV Admin portal.
Due to this newly introduced functionality a synchronous alert is raised in vROPS when an SNMP trap based event is forwarded
by OMIVV. This alert is always associated with the corresponding server/chassis from which the trap is generated. OMIVV also
triggers a health metric poll on the corresponding server/chassis so that the updated metrics are available to vROPS on the
next collect cycle. These updated metrics leads to the generation of an internal alert for the corresponding component.
NOTE: It is recommended to cancel the alerts when you addressed the issues corresponding to any specific alert. In case,
the alert is not cleared, and if the same event occurs again, you may see an older time stamp associated to that alert.
NOTE: Identify the external alert using Dell Alert with message ID. The alert format is: Dell EMC <Server/Chassis>
<Critical/Warning/Information>- [Message ID].
Power monitoring report for servers
Power Monitoring report displays the server metrics for the Dell EMC PowerEdge servers. For more information, see Dell EMC
Server Power Details on page 12.
Perform the following steps to generate power monitoring report:
1. On the Dashboards tab, click Reports.
2. Select Dell EMC Server Power Consumption Report.
3. Click Run Template and select All Objects →Dell EMC OpenManage Adapter→Dell EMC Servers Group →Dell
Servers Group.
4. Click OK.
Power monitoring reports are generated for all Dell EMC servers.
Viewing dashboards
Dashboards enable you to monitor and analyze the Dell EMC PowerEdge servers and chassis environment in vROPS.
The following dashboards are available in vRealize Operations Manager:
● Dell EMC Servers Overview Dashboard
● Dell EMC Server Detailed Dashboard
● Dell EMC Chassis Overview Dashboard
● Dell EMC Chassis Detailed Dashboard
Dell EMC servers overview dashboard
Following are the parameters displayed in the Dell EMC Servers Overview Dashboard:
6
OpenManage Management Pack for vRealize Operations Manager