OpenManage Management Pack for vRealize Operations Manager version 1.2 User’s Guide October 2020 Rev.
Notes, cautions, and warnings NOTE: A NOTE indicates important information that helps you make better use of your product. CAUTION: A CAUTION indicates either potential damage to hardware or loss of data and tells you how to avoid the problem. WARNING: A WARNING indicates a potential for property damage, personal injury, or death. © 2020 Dell Inc. or its subsidiaries. All rights reserved. Dell, EMC, and other trademarks are trademarks of Dell Inc. or its subsidiaries.
Contents Chapter 1: OpenManage Management Pack for vRealize Operations Manager................................4 What is new in this release................................................................................................................................................4 Use case scenarios..............................................................................................................................................................5 Monitoring the servers...........................
1 OpenManage Management Pack for vRealize Operations Manager OpenManage Management Pack for vRealize Operations Manager enables monitoring of different metrics and hardware resources in the PowerEdge server (12th generation of PowerEdge servers and later) and chassis by using vRealize Operations Manager. OpenManage Management Pack for vRealize Operations Manager requires VMware vRealize Operations Manager version 6.5 or later.
Use case scenarios This section describes typical use cases and tasks that can be performed with OpenManage Management Pack for vRealize Operations Manager. Monitoring the servers Server monitoring is the process of reviewing and analyzing a server for health, inventory, availability, and other operationsrelated processes. You can also monitor the components of servers such as CPU, memory, PSU, fan, temperature, physical disks, and so on.
SNMP Trap Monitoring Prior to this 1.2 release, OpenManage Management Pack for vRealize Operations Manager used to collect the metrics of the PowerEdge server and the related Chassis at regular intervals (by default 5 minutes) from OMIVV. OMIVV polls the health metrics and extended metrics of the PowerEdge servers and it’s associated Chassis every 1 hour and every 2 hours respectively.
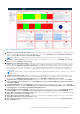
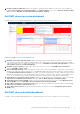
Figure 1. Dell EMC Servers Overview Dashboard 1. Dell EMC Servers Environmental Health: Displays the health status of all the servers. Red indicates Critical state, yellow indicates Warning state, and green indicates Healthy state. The source of Dell EMC Servers Environmental Health is defined as Server Metrics|Server Overall Health (Enum). NOTE: Health status is reported based on polling, SNMP Trap (External Alerts) does not impact this heatmap. 2.
NOTE: Health status is not reported if Warranty Notification Threshold is disabled at OMIVV or warranty is not collected for server. Changing the top high temperature to Celsius By default the temperature parameter is set to Fahrenheit. Perform the following steps to change the temperature to Celsius: 1. Launch the vRealize Operations Manager console. 2. Click Dashboards and select Dell EMC Servers Overview Dashboard. 3. Click Edit Widget at Top High Temperature Servers(Fahrenheit) tab.
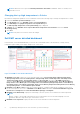
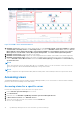
5. Firmware Update Pending View: Displays the number of pending firmware updates for the server, such as number of pending Critical Updates, Recommended Updates, and Optional Updates. The source of Firmware Update Pending View is defined as Dell EMC Server Available Firmware Update Summary. Dell EMC chassis overview dashboard Dell EMC chassis overview dashboard displays the overall heath status of the chassis environment. Figure 3. Dell EMC Chassis Overview Dashboard 1.
Figure 4. Dell EMC chassis detailed dashboard 1. Dell EMC Chassis List: Displays the chassis and the details such as, Hostname, Model, ServiceTag, IPAddress, Chassis Overall health, PSU Rollup Status, and Fan Rollup Status. The source of Dell EMC Chasssi List is defined as Chassis Metrics|Model, Chassis Metrics|Host Name, Chassis Metrics|IpAddress, Chassis Metrics|Service Tag, Chassis Metrics|Chassis Overall Health, Chassis Metrics|PSU Rollup Status, and Chassis Metrics|Fan Rollup Status. 2.
Accessing views for the group of servers Perform the following steps to access Dell server group views for all the servers: 1. Launch vRealize Operations Manager for a console. 2. Click Environment. 3. Expand All Objects, and click Dell OpenManage Adapter. 4. Expand Dell EMC Servers Group, again click Dell Servers Group, and then select the Details tab. A List of views is displayed.
Dell EMC Server Firmware Summary List Dell EMC server firmware summary list displays Servicetag, Hostname, Component, Current Version, Available Version, Criticality, Cluster name, Cluster Profile name, vCenter Server and Reboot Required of Dell EMC PowerEdge servers. ● If the host is part of a vSAN cluster with Dell Cluster Profile, which is associated with a Repository Profile, then this report is generated based on the associated repository profile.
Viewing alerts OpenManage Management Pack for vRealize Operations Manager displays any events from the Dell EMC servers, chassis and associated components as alerts. It also recommends that you perform certain steps to overcome the unusual events. If the extended monitoring or firmware metric collection job fails for a server, a warning alert is created for that particular server. There are two different types of alerts.
2 License metrics of OMIVV To access the license metrics of OMIVV: Click Environment > All objects > Dell EMC OpenManage Adapter > Dell EMC OpenManage Adapter Instance > Select Instance > All metrics > License Info. The license for OMIVV is also the licensing used for the management pack. License metrics of OMIVV enables you to view the license information and metrics.
3 Dell EMC server metrics To access Dell EMC server metrics: Click Environment > All objects > Dell EMC OpenManage Adapter > Dell EMC server > Select Server > All Metrics. Table 1.
Table 1.
Table 1. Dell EMC Server Metrics (continued) MaxThreshold is 9999 and MinThreshold is -999 (for vROPS). The values remain same for both Celsius and Fahrenheit.
Table 1.
4 Dell EMC chassis metrics To access Dell EMC chassis metrics: Click Environment > All objects > Dell EMC OpenManage Adapter > Dell EMC chassis > Select chassis > All Metrics > chassis Metrics. Table 2.
5 View DellEMC PowerEdge servers and ESXi of VMware relationship This dashboard provides a visual representation of server relationship between DellEMC PowerEdge servers and ESXi. NOTE: Admin can see server and ESXI relationship only when the OMIVV managed vCenter is added to vROPS. To view the object relationship health tree, see Dell EMC server detailed dashboard on page 8.
6 Known Issues ● Historical data for HDDs are not available after the OpenManage Management Pack for vRealize Operations Manager Version 1.1 upgrade. This is an expected behavior, with the latest upgrade, adapter is offering HDD and SSD data separately. However, historical data are available only for the SSDs. HDD metrics are freshly populated since the time adapter has been updated. ● After OpenManage Management Pack for vRealize Operations Manager Version 1.
7 Accessing documents from the Dell EMC support site You can access the required documents in one of the following ways: ● Using the following links: ○ For Dell EMC Enterprise Systems Management, Dell EMC Remote Enterprise Systems Management, and Dell EMC Virtualization Solutions documents — https://www.dell.com/esmmanuals ○ For Dell EMC OpenManage documents — https://www.dell.com/openmanagemanuals ○ For iDRAC documents — https://www.dell.