
Users Guide
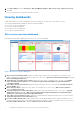
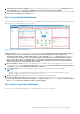
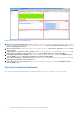
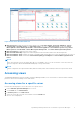
Table Of Contents
- OpenManage Management Pack for vRealize Operations Manager version 1.0 User’s Guide
- OpenManage Management Pack for vRealize Operations Manager
- License metrics of OMIVV
- Dell server metrics
- Dell chassis metrics
- View Dell PowerEdge servers and ESXi of VMware relationship
- Issues
- Accessing support content from the Dell EMC support site

8. Top High Fan Speed Servers (RPM): Displays the top 15 high fan speed servers. The source of Top High Fan Speed
Servers (RPM) is defined as Dell Server Fan|Dell Server Fan Metrics|Current Reading (RPM).
9. Select Above For Power Consumption Trend: Displays the power consumption trend for the server selected in the Top
High Power Consuming Servers (watt) widget.
Dell server detailed dashboard
In the Dell server detailed dashboard, you can view the overall health status of the fan, battery, voltage, memory, temperature,
physical disk, power supply, and processor of the server.
Figure 2. Dell Server Detailed Dashboard
1. Dell Server List: Displays the servers and the details such as, Server Rollup Status, Memory Rollup Status, Battery
Rollup Status, Processor Rollup Status, Voltage Rollup Status, PSU Rollup Status, Fan Rollup Status,
Temperature Rollup Status, Storage Rollup Status, and Proactive HA. The source of Dell Server List is defined as
Server Metrics|Server Rollup Status, Server Metrics|Memory Rollup Status, Server Metrics|Battery Rollup
Status, Server Metrics|Processor Rollup Status, Server Metrics|Voltage Rollup Status, Server Metrics|PSU
Rollup Status, Server Metrics|Fan Rollup Status, Server Metrics|Temperature Rollup Status,Server Metrics|
Storage Rollup Status, and Server Metrics|ProactiveHA.
2. Dell Server Metric Chart: Displays the system board power consumption and energy consumption of the server for the
selected period. The source of Dell Server Metric Chart is defined as Server Extended Metrics|System Board Power
Consumption and Server Extended Metrics|Energy Consumption.
3. Server Relationship: Displays the relationship of the host system, servers and the associated components.
NOTE:
Battery, voltage, or the IDSDM components are not associated with a server in the relationship map. For more
information about the components, log in to the iDRAC console.
4. Dell Server Top Alerts: Displays the alerts of the servers and the associated components.
5. Firmware Update Pending View: Displays the number of pending firmware updates for the server, such as number of
pending Critical Updates, Recommended Updates, and Optional Updates. The source of Firmware Update Pending
View is defined as Dell Server Available Firmware Update Summary.
Dell chassis overview dashboard
Dell chassis overview dashboard displays the overall heath status of the chassis environment.
OpenManage Management Pack for vRealize Operations Manager
7