
Users Guide
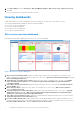
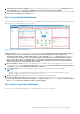
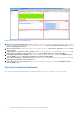
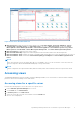
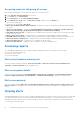
Table Of Contents
- OpenManage Management Pack for vRealize Operations Manager version 1.0 User’s Guide
- OpenManage Management Pack for vRealize Operations Manager
- License metrics of OMIVV
- Dell server metrics
- Dell chassis metrics
- View Dell PowerEdge servers and ESXi of VMware relationship
- Issues
- Accessing support content from the Dell EMC support site

3. Click Run Template and select All Objects →Dell OpenManage Adapter→Dell Servers Group →Dell Servers Group.
4. Click OK.
Power monitoring reports are generated for all Dell servers.
Viewing dashboards
Dashboards enable you to monitor and analyze the Dell PowerEdge servers and chassis environment in vROPS.
The following dashboards are available in vRealize Operations Manager:
●
Dell Servers Overview Dashboard
● Dell Server Detailed Dashboard
● Dell Chassis Overview Dashboard
● Dell Chassis Detailed Dashboard
Dell servers overview dashboard
Following are the parameters displayed in the Dell Servers Overview Dashboard:
Figure 1. Dell Servers Overview Dashboard
1. Dell Servers Environmental Health: Displays the health status of all the servers. Red indicates Critical state, yellow
indicates Warning state, and green indicates Healthy state. The source of Dell Servers Environmental Health is defined as
Dell Server|Badge|Health Status.
2. Top High Power Consuming Servers (watt): Displays the top 15 power consuming servers. The source of Top High
Power Consuming Servers (watt) is defined as Dell Server|Server Extended Metrics| System Board Power
Consumption (Watt).
3. Select Above For Fan Speed Trend: Displays the fan speed trend for the server selected in the Top High Fan Speed
Servers (RPM) widget.
4. Dell Servers Top Alerts: Displays the top 15 alerts of PowerEdge servers. The source of Dell Servers Top Alerts is
defined as Dell Servers Group.
5. Top High Temperature Servers (Fahrenheit): Displays the top 15 high temperature servers. The source of Top High
Temperature Servers is defined as Dell Sever System Board Inlet Temperature|Dell Sever System Board Inlet
Temperature Sensor Metrics|Current Reading (Fahrenheit).
6. Select Above For Temperature Trend: Displays the system board inlet temperature trend for the server selected in the
Top High Temperature Servers (Fahrenheit) widget.
7. Proactive HA Distribution View: Displays whether the Proactive High Availability (HA) is enabled or disabled. For more
information about Proactive HA, see OpenManage Integration for VMware vCenter User's Guide version 4.0. The source of
Proactive HA Distribution View is defined as Dell Proactive HA Servers View.
6
OpenManage Management Pack for vRealize Operations Manager