OpenManage Management Pack for vRealize Operations Manager version 1.0 User’s Guide December 2020 Rev.
Notes, cautions, and warnings NOTE: A NOTE indicates important information that helps you make better use of your product. CAUTION: A CAUTION indicates either potential damage to hardware or loss of data and tells you how to avoid the problem. WARNING: A WARNING indicates a potential for property damage, personal injury, or death. © 2017-2018 Dell Inc. or its subsidiaries. All rights reserved. Dell, EMC, and other trademarks are trademarks of Dell Inc. or its subsidiaries.
Contents Chapter 1: OpenManage Management Pack for vRealize Operations Manager................................4 What's new in this release.................................................................................................................................................4 Use case scenarios.............................................................................................................................................................. 4 Monitoring the servers..........................
1 OpenManage Management Pack for vRealize Operations Manager OpenManage Management Pack for vRealize Operations Manager enables monitoring of different metrics and hardware resources in the Dell server (12th generation servers and later) and chassis by using vRealize Operations Manager. OpenManage Management Pack for vRealize Operations Manager requires VMware vRealize Operations Manager version 6.3 or later.
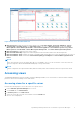
Monitoring the servers Server monitoring is the process of reviewing and analyzing a server for health, inventory, availability, and other operationsrelated processes. You can also monitor the components of servers such as CPU, memory, PSU, fan, temperature, physical disks, and so on. For more information, see the Dell servers overview dashboard on page 6. Perform the following steps to monitor a server: 1. Launch the vRealize Operations Manager console. 2. From the Home tab, click Environment. 3.
3. Click Run Template and select All Objects →Dell OpenManage Adapter→Dell Servers Group →Dell Servers Group. 4. Click OK. Power monitoring reports are generated for all Dell servers. Viewing dashboards Dashboards enable you to monitor and analyze the Dell PowerEdge servers and chassis environment in vROPS.
8. Top High Fan Speed Servers (RPM): Displays the top 15 high fan speed servers. The source of Top High Fan Speed Servers (RPM) is defined as Dell Server Fan|Dell Server Fan Metrics|Current Reading (RPM). 9. Select Above For Power Consumption Trend: Displays the power consumption trend for the server selected in the Top High Power Consuming Servers (watt) widget.
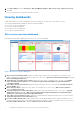
Figure 3. Dell Chassis Overview Dashboard 1. Dell Chassis Environmental Health: Displays the health status of all the chassis. Red indicates the critical state, yellow indicates warning state, and green indicates healthy state. The source of Dell Chassis Environmental Health is defined as Dell Chassis|Badge|Health State. 2. Dell Chassis Top Alerts: Displays top 15 alerts of the chassis. The source of Dell Chassis Top Alerts is defined as Dell Chassis Group. 3.
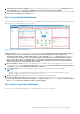
Figure 4. Dell Chassis Detailed Dashboard 1. Dell Chassis List: Displays the chassis and the details such as, Hostname, Model, ServiceTag, IPAddress, Chassis Overall health, PSU Rollup Status, and Fan Rollup Status. The source of Dell Chasssi List is defined as Chassis Metrics|Model, Chassis Metrics|Host Name, Chassis Metrics|IpAddress, Chassis Metrics|Service Tag, Chassis Metrics|Chassis Overall Health, Chassis Metrics|PSU Rollup Status, and Chassis Metrics|Fan Rollup Status. 2.
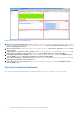
Accessing views for the group of servers Perform the following steps to access Dell server group views for all the servers: 1. Launch vRealize Operations Manager for a console. 2. On the Home tab, click Environment. 3. Expand All Objects, and click Dell OpenManage Adapter. 4. Expand Dell Servers Group, again click Dell Servers Group, and then select the Details tab. A List of views is displayed.
1. Critical - Indicates that the component has either failed or failure is imminent. It requires immediate attention and may require replacement. 2. Warning - Indicates that a probe or other monitoring device has detected a reading for the component that is exceeding the acceptable level. The component may be functioning, but it can fail. The component may also be functioning in an impaired state.
2 License metrics of OMIVV The license for OMIVV directly interprets to the licensing used for the management pack. License metrics of OMIVV enables you to view the license information and metrics. The following metrics are associated with Dell OMIVV License: ● ● ● ● ● ● Available Nodes: Displays the number of licenses that are available. Used Nodes: Displays the number of licenses that are used. Evaluation License: Displays the current license type whether or not it is evaluation or standard license.
3 Dell server metrics Table 1.
Table 1.
Table 1. Dell Server Metrics (continued) Media Type Remaining Rated Write Endurance Smart Alert Enabled State Total Disk Size (GB) NOTE: The default value for non-SSD disk is 255.
4 Dell chassis metrics Table 2. Dell Chassis Metrics Resources Available Chassis- Resource Metrics Chassis Metrics Chassis Overall Health Enegy Consumption (KWh) Fan Rollup Status Host Name IPAddress Model Overall Warranty Status PSU Rollup Status Service Tag System Peak Power End Date Time System Peak Power Start Date Time System Peak Power (Watt) NOTE: When rack server Mode is enabled, chassis PSU and fans are discovered and monitored as server components.
5 View Dell PowerEdge servers and ESXi of VMware relationship This dashboard provides a visual representation of server relationship between Dell PowerEdge servers and ESXi. To view the object relationship health tree, see Dell server detailed dashboard on page 7.
6 Issues ● Servers that have an in-built PSU or the drives that are connected to Embedded Controller always display a warning status in vROPS, because Embedded Controller is not monitored by iDRAC. ● The removed PSUs or fans exist under Dell chassis. In such a situation, because the health cannot be retrieved the FAN or PSU status is displayed as Critical.
7 Accessing support content from the Dell EMC support site Access supporting content related to an array of systems management tools using direct links, going to the Dell EMC support site, or using a search engine. ● Direct links: ○ For Dell EMC Enterprise Systems Management and Dell EMC Remote Enterprise Systems Management—https:// www.dell.com/esmmanuals ○ For Dell EMC Virtualization Solutions—https://www.dell.com/SoftwareManuals ○ For Dell EMC OpenManage—https://www.dell.