
Users Guide

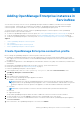

Table Of Contents
- Dell EMC OpenManage Integration Version 1.2 with ServiceNow User’s Guide
- Contents
- Overview of Dell EMC OpenManage Integration with ServiceNow
- License requirements for OpenManage Integration with ServiceNow
- Required user privileges
- OpenManage Integration for ServiceNow Dashboard
- Adding OpenManage Enterprise instances in ServiceNow
- Inventorying and monitoring of devices
- Dell EMC PowerEdge Server basic inventory information for servers
- Dell EMC PowerEdge Chassis basic inventory information
- Dell EMC PowerEdge Server detailed inventory information
- Dell EMC chassis detailed inventory information for chassis
- Device health sync for servers
- Configure Parallel Queues
- Activate or deactivate transform maps for server
- Activate or deactivate transform maps for chassis
- Alert management—View alerts and the corresponding OpenManage Enterprise events
- Event management—View all events
- Incident management—View and manage incidents created for the OpenManage Enterprise events
- Enable or disable Alert Correlation Rule
- Enable or disable alert management rule
- Device Event Sync
- Adding a SupportAssist Enterprise instance in ServiceNow
- Incident management—View and monitor incidents of SupportAssist Enterprise and SupportAssist Enterprise Plugin cases
- Change incident priority
- Change impact value and urgency value in SupportAssist Enterprise connection profile
- Change impact value and urgency value of a specific incident
- Change impact value and urgency value for multiple incidents
- Incident management—View and monitor incidents of SupportAssist Enterprise Plugin cases
- Properties table—field definitions
- Troubleshooting
- Contact Dell EMC Support for OpenManage Integration with ServiceNow
- Contacting Dell EMC
- Accessing support content from the Dell EMC support site
k. Metric Name
l. Maintenance
○ Critical Alerts This section provides you the total number of critical alerts. Click on the number to view the details.
■ Number
■ Group
■ Severity
■ Priority group
■ Priority
■ State
■ Source
■ Description
■ Node
■ Configuration item
■ Metric Name
■ Maintenance
○ Warning AlertsThis section provides you the total number of critical alerts. Click on the number to view the details.
■ Number
■ Group
■ Severity
■ Priority group
■ Priority
■ State
■ Source
■ Description
■ Node
■ Configuration item
■ Metric Name
■ Maintenance
○ Alert Group-Severity This section provides you the information based on the severity of the alert and are
segregated in a bar graph.
○ Top 10 Active AlertProvides you information on the active alerts represented in a bar graph.
○ Alert TrendProvides you information on the alert count based on date.
● OME-Incidents In this section, you can view
○ Total number of incidentsThis number includes all the incidents including open and resolved incidents. Click on the
number to view the details:
a. Number
b. Opened
c. Short description
d. Caller
e. Priority
f. State
g. Assignment group
h. Assigned to
i. Updated
j. Updated by
○ Open IncidentProvides you total of Open Incidents. Click on the number to view the details:
a. Number
b. Opened
c. Short description
d. Caller
e. Priority
f. State
g. Assignment group
h. Assigned to
i. Updated
j. Updated by
12
OpenManage Integration for ServiceNow Dashboard