
Users Guide


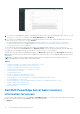
Table Of Contents
- Dell EMC OpenManage Integration Version 1.2 with ServiceNow User’s Guide
- Contents
- Overview of Dell EMC OpenManage Integration with ServiceNow
- License requirements for OpenManage Integration with ServiceNow
- Required user privileges
- OpenManage Integration for ServiceNow Dashboard
- Adding OpenManage Enterprise instances in ServiceNow
- Inventorying and monitoring of devices
- Dell EMC PowerEdge Server basic inventory information for servers
- Dell EMC PowerEdge Chassis basic inventory information
- Dell EMC PowerEdge Server detailed inventory information
- Dell EMC chassis detailed inventory information for chassis
- Device health sync for servers
- Configure Parallel Queues
- Activate or deactivate transform maps for server
- Activate or deactivate transform maps for chassis
- Alert management—View alerts and the corresponding OpenManage Enterprise events
- Event management—View all events
- Incident management—View and manage incidents created for the OpenManage Enterprise events
- Enable or disable Alert Correlation Rule
- Enable or disable alert management rule
- Device Event Sync
- Adding a SupportAssist Enterprise instance in ServiceNow
- Incident management—View and monitor incidents of SupportAssist Enterprise and SupportAssist Enterprise Plugin cases
- Change incident priority
- Change impact value and urgency value in SupportAssist Enterprise connection profile
- Change impact value and urgency value of a specific incident
- Change impact value and urgency value for multiple incidents
- Incident management—View and monitor incidents of SupportAssist Enterprise Plugin cases
- Properties table—field definitions
- Troubleshooting
- Contact Dell EMC Support for OpenManage Integration with ServiceNow
- Contacting Dell EMC
- Accessing support content from the Dell EMC support site

OpenManage Integration for ServiceNow
Dashboard
This topic provides you information on the total devices, device type, device model, connections profile. With the help of the
dashboard, user can see OME and SAE incidents and overall information quickly.
To view the dashboard:
1. On the ServiceNow page, in the filter navigation tab type Dell EMC OpenManage Integration
2. Click on the OMISNOW-Dashboard from the Dashboard drop down.
On the dashboard home page, you will see four tabs
● Overview This section provides you the overall information on the total numbers of Chassis registered, total number of
servers registered, alerts, device type, severity of the alert and Device Model. You can click on the number to view more
details. Following are the information provided in the overview section.
a. Total Devices: This provides information on total number of records of registered devices. Click on the number to
view the list of devices created. Following are the details provided in the list view:
○ Name
○ Manufacturer
○ Model ID
○ Operating System
○ OS Version
○ Description
■ Monitored
■ Status
■ ChassisServiceTag
■ ExpressServiceCode
■ ExpressServiceGroup
■ OMEip
■ id
○ Class
b. Total Alerts Provides you an overall of alerts created. You can click on the number to view more details on the total
number of alerts.
c. Server TypeThis device type information is curated based on the devices registered and is represented in a pie chart
for better understanding.
d. Alert SeverityThis section provides an overall information on the alert count represented in a bar graph.
e. Server and chassis Model This section provides you an overall information represented through pie chart on the
device model.
f. OME-Connection ProfileThis section provides you details on how many OME connection profiles are created. You
can also see whether the connection has SupportAssist Plugin enables or not.
g. SAE-Connection ProfileThis section provides you details on how many SAE connection profiles are created.
● AlertsIn this section, you can see
○ Total AlertsWhen you click on the number, it lists alerts with following details:
a. Number
b. Group
c. Severity
d. Priority group
e. Priority
f. State
g. Source
h. Description
i. Node
j. Configuration item
4
OpenManage Integration for ServiceNow Dashboard 11