
Users Guide
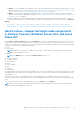
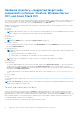
Table Of Contents
- Dell EMC OpenManage Integration Version 2.0 with Microsoft Windows Admin Center User’s Guide
- Contents
- Overview of OpenManage Integration with Microsoft Windows Admin Center
- Getting started with OpenManage Integration with Microsoft Windows Admin Center
- Ports required by Dell EMC OpenManage Integration with Microsoft Windows Admin Center
- Manage Dell EMC PowerEdge Servers
- Manage Failover clusters, Azure Stack HCI, and Windows Server HCI clusters
- View iDRAC details of the PowerEdge servers and nodes of HCI and Failover clusters
- Update PowerEdge servers and nodes of Windows Server HCI, Azure Stack HCI, and Failover clusters using OpenManage Integration extension
- Integrated deploy and update of Azure Stack HCI clusters
- Full Stack Cluster-Aware Updating for Azure Stack HCI clusters using OpenManage Integration snap-in
- Troubleshooting
- Identifying the generation of your Dell EMC PowerEdge server
- Contacting Dell EMC
- Glossary
- Appendix

● Update—to view and update the compliance charts of the nodes and components. Expand the required node to view a
detailed compliance report of the components. See Update PowerEdge servers and nodes of Windows Server HCI, Azure
Stack HCI, and Failover clusters using OpenManage Integration extension on page 19.
● iDRAC—to view the iDRAC details of the individual nodes. You can directly launch the iDRAC console from Windows
Admin Center by using the OpenManage Integration. See View iDRAC details of the PowerEdge servers and nodes of HCI
and Failover clusters on page 18.
The health, hardware inventory, and iDRAC details are cached and will not be loaded each time the extension is loaded. To
view the latest health and inventory status and iDRAC details, in the upper-right corner of the Health Status, click Refresh.
Topics:
• Health status—Supported target node components in Failover Clusters, Windows Server HCI, and Azure Stack HCI
• Hardware inventory—Supported target node components in Failover Clusters, Windows Server HCI, and Azure Stack HCI
Health status—Supported target node components
in Failover Clusters, Windows Server HCI, and Azure
Stack HCI
On the Cluster - Azure Stack HCI page, select the Health tab to view the overall health status of the Failover or HCI cluster
and the health status of the following target node components of the nodes in Failover Cluster, Windows Server HCI, or Azure
Stack HCI. Selecting critical or warning section in the overall health status doughnut chart displays corresponding nodes and the
components in the critical or warning state respectively.
● CPUs
● Accelerators
NOTE:
Health status information is available for Accelerators in YX4X models of PowerEdge servers and above with
iDRAC version 4.00.00.00 or newer.
● Memory
NOTE: Intel DIMM memory is identified as IntelPersistent with an icon.
● Storage Controllers
● Storage Enclosures
● Physical Disks
● iDRAC
● Power Supplies
● Fans
● Voltages
● Temperatures
The health statuses are represented by using a doughnut chart. You can select different sections in the doughnut chart to filter
the health status of the components. For example, when you select the red section, components with critical health status are
only displayed.
In a Failover or HCI cluster, if the different sections of the doughnut chart for individual components are selected, the
respective nodes with the component health status are listed. Expand the nodes to view the components in a particular health
state.
To view the latest health status, in the upper-right corner of the Health tab, click Refresh.
NOTE:
For software storage controllers and physical disks attached to embedded SATA controller, the health inventory
status will always be displayed as "Unknown".
Manage Failover clusters, Azure Stack HCI, and Windows Server HCI clusters 15