
Users Guide
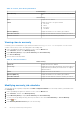
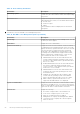
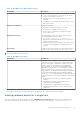
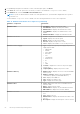
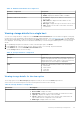
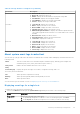
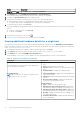
Table Of Contents
- OpenManage Integration for VMware vCenter Version 4.1 Web Client User's Guide
- Introduction
- About Administration Console
- Using Administration Portal
- Registering vCenter server by non-administrator user
- Registering a vCenter server
- Uploading license to Administration Portal
- Managing the virtual appliance
- Restarting virtual appliance
- Changing host name of virtual appliance
- Updating virtual appliance repository location and virtual appliance
- Upgrading OMIVV from existing version to current version
- Updating appliance through backup and restore
- Downloading the troubleshooting bundle
- Setting up HTTP proxy
- Setting up Network Time Protocol (NTP) servers
- Configuring deployment mode
- Generating Certificate Signing Request
- Uploading HTTPS certificate
- Setting up global alerts
- Managing backup and restore
- About vSphere client console
- Using Administration Portal
- Managing multiple appliances
- Accessing OpenManage Integration from web client
- OpenManage Integration for VMware vCenter licensing
- Appliance configuration for VMware vCenter
- Profiles
- Inventory and warranty management
- About firmware updates
- Events, alarms, and health monitoring
- Chassis management
- Deploying hypervisor
- About host, bare-metal, and iDRAC compliance
- Security roles and permissions
- Troubleshooting
- Frequently Asked Questions (FAQ)
- Why Export All button fails to export to .CSV file in Google chrome?
- iDRAC license type and description are displayed incorrectly for non-compliant vSphere hosts
- Dell EMC icon is not displayed after unregistering vCenter from earlier OMIVV version and then registering same vCenter with later OMIVV version
- Configuration wizard settings are overridden by default settings each time it is invoked
- Dell provider is not displayed as health update provider
- Why is inventory failing when performing firmware update task on ESXi 5.x host?
- Host inventory or test connection fails due to invalid or unknown iDRAC IP. How can I get a valid iDRAC IP?
- On running fix noncompliant vSphere hosts wizard, why the status of a specific host is displayed as "Unknown"?
- Dell privileges that are assigned while registering the OMIVV appliance are not removed after unregistering OMIVV
- Dell Management Center does not display all the relevant logs when trying to filter a severity category. How can I view all the logs?
- How do I resolve error code 2000000 caused by VMware Certificate Authority (VMCA)?
- In Administration Console, why Update Repository Path is not set to default path after I reset appliance to factory settings?
- Why warranty and inventory schedule for all vCenters is not applying when selected from the job queue page?
- What should I do when a web communication error in the vCenter web client appears after changing the DNS settings in OMIVV?
- Why does the settings page fail to load, if I navigate away and again go back to the settings page?
- Why “Task cannot be scheduled for the time in the past” error in inventory schedule/warranty schedule page of Initial Configuration Wizard appear?
- Why installation date appears as 12/31/1969 for some of the firmware on the firmware page?
- Successive global refresh cause exception to be thrown in the recent task window. How can I resolve the error?
- Why is web client UI distorted for few Dell screens in IE 10?
- Why am I not seeing OpenManage Integration icon in web client even if registration of plug-in to vCenter was successful?
- Even if repository has bundles for selected 11G system, why is firmware update displaying that there are no bundles for firmware update?
- Why is DNS configuration settings restored to original settings after appliance reboot if appliance IP and DNS settings are overwritten with DHCP values
- Using OMIVV to update the Intel network card with firmware version of 13.5.2 is not supported
- Using OMIVV to update Intel network network card from 14.5 or 15.0 to 16.x fails due to staging requirement from DUP
- Why trying firmware update with invalid DUP, hardware update job status on vCenter console neither fails nor times-out for hours, although job status in LC prompts as ‘FAILED’?
- Why does Administration Portal display unreachable update repository location?
- Why did system not enter maintenance mode when I performed one-to-many firmware update?
- Why is chassis global health still healthy when some of power supply status has changed to critical?
- Why is processor version displayed “Not Applicable” in processor view in system overview page?
- What generation of Dell servers does OMIVV configure and support for SNMP traps?
- What vCenter servers are managed by OMIVV?
- Does OMIVV support vCenter in linked mode?
- What are required port settings for OMIVV?
- Why is password not changed for user used for bare-metal discovery after successfully applying hardware profile or system profile that has same user with new changed credentials in iDRAC user list?
- Why am I unable to view new iDRAC version details listed on vCenter hosts and clusters page?
- How can I test event settings by using OMSA to simulate temperature hardware Fault?
- Although OMSA agent is installed on OMIVV host system, I still get error message that OMSA is not installed. How do I resolve this error?
- Can OMIVV support ESXi with lockdown mode enabled?
- When I tried to use lockdown mode, it fails
- What do I do if creation of hardware profile fails if I am using reference server?
- Why attempting to deploy ESXi on server fails?
- Why hypervisor deployments failing on Dell PowerEdge R210 II machines?
- Why auto discovered systems are displayed without model information in Deployment wizard?
- NFS share is set up with ESXi ISO, but deployment fails with errors mounting share location
- How do I force removal of virtual appliance?
- Entering a Password in the Backup Now Screen Receives an Error Message
- In vSphere web client, clicking Dell server management portlet or Dell icon returns 404 error
- What should I do as firmware update failed?
- What should I do as vCenter registration failed?
- Performance during connection profile test credentials is slow or unresponsive
- Does OMIVV support VMware vCenter server appliance?
- Why is firmware level not updated when I have performed firmware update with Apply on Next reboot option and system was rebooted?
- Why is host still displayed under chassis even after removing host from vCenter tree?
- In Administration Console, why Update Repository Path is not set to default path after I reset appliance to factory settings?
- After backup and restore of OMIVV, why alarm settings are not restored?
- Hypervisor deployment fails when NIC Partitioning (NPAR) is enabled on a target node and disabled in System Profile
- Available virtual appliance version displays wrong information when the available version is lesser than the current version
- Bare-metal deployment issues
- Frequently Asked Questions (FAQ)
- Related Documentation
- System specific attributes
- Customization attributes
- Additional information

Option Description
From the Home page In the Home page, click Hosts and Clusters.
2. In the Monitor tab, select Dell EMC Host Information > System Event Log.
The recent system log entries provide the 10 most recent system event log entries.
3. To update the System Event Log, perform a global refresh.
4. To limit (filter) the number of event log entries, choose one of the following options:
● In the search filter text box, to dynamically filter the log entries, enter a text string.
● To clear the filter text box, click X and all the event log entries are displayed.
5. To clear all event log entries, click Clear Log.
A message is displayed stating that all log entries are deleted after they are cleared and you can select one of the following
options:
● To agree to clear log entries, click Clear Log.
● To cancel, click Cancel.
6. To export the event log to a .CSV file, click
.
7. To browse to the location and save the system event log, click Save.
Viewing additional hardware details for a single host
You can view the firmware, power monitoring, warranty status details for a single host on the Dell EMC Hosts Information
tab. For information to appear on this page, run an inventory job. The hardware views directly report the data from OMSA and
iDRAC. See Running chassis inventory job now.
1. In OpenManage Integration for VMware vCenter, in the Navigator pane, click Hosts.
2. In the Objects tab, select the specific host for which you want to view <Component Name> details.
3. In the Monitor tab, select the Dell EMC Host Information tab.
On the Hardware: <Component Name> subtab, view the following information for each of the components:
Table 19. Single host information (continued)
Component
Information
Firmware
The host page lets you use the search, filter, and export a
CSV file of firmware information
● Name—displays the name of all the firmware on this
host
● Type—displays the type of firmware
● Version—displays the version of all the firmware on this
host
● Installation Date—displays the installation date
Power Monitoring
NOTE: The host time, as used here, means the local
time where the host is located.
● General Information—displays the Power Budget and
Current Profile name
● Threshold—displays the Warning and Failure thresholds
in watts
● Reserve Power Capacity—displays the Instant and
Peak reserve power capacity in watts
Energy Statistics
● Type—displays the energy statistics type
● Measurement Start Time (Host Time)—displays the
date and time when the host began to consume power.
● Measurement Finish Time (Host Time)—displays the
date and time when the host stopped to consume power.
● Reading—displays the average value of readings over a
one-minute time period
● Peak Time (Host Time)—displays the date and time of
the host peak amps
60 Inventory and warranty management