
Users Guide

Reading—displays the average value of readings over a one-minute time period.
• Peak Time (Host Time)—displays the date and time of the host peak amps.
• Peak Reading—displays the System Peak Power statistic, which is the peak power that is consumed by the system (in watts).
NOTE: Power monitoring information is not available for hosts with cabled PSU or for modular servers.
NOTE: For hosts managed using chassis, complete power monitoring information is not displayed.
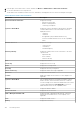
View warranty information of a single host
To view a warranty status, ensure that you run a warranty job. See Schedule warranty retrieval jobs. The Warranty Status page enables
you to monitor the warranty expiration date. The warranty settings control when server warranty information is retrieved from Dell online
by enabling or disabling the warranty schedule, and then setting the Minimum Days Threshold alert.
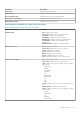
• Provider—displays the name of the provider for the warranty.
• Description—displays a description.
• Status—displays the warranty status of the host. Status options include:
• Active—the host is under warranty, and has not exceeded any threshold.
• Warning—the host is Active, but exceeded the warning threshold.
• Critical—same as warning, but for a critical threshold
• Expired—the warranty has expired for this host.
• Unknown—OMIVV does not get warranty status because the warranty job is not run, an error has occurred getting the data, or
the system does not have a warranty.
• Entitlement Type—displays the following statuses:
• Initial
• Extended
• Expired
• Start Date—displays the start date of the warranty.
• End Date—displays the end date of the warranty.
• Days To Expire—displays the days left on the warranty.
• Last Updated—the last time the warranty was updated.
View system event log information of a single host
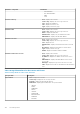
System event log (SEL) provides status information for hardware that is discovered by OMIVV and displays the following information:
• Status—There are several status icons such as Informational (blue exclamation point), Warning (yellow triangle with exclamation
point), Error (red X), and Unknown (a box with a ?).
The severity levels are defined as:
• Info
• Warning
• Error
• Time (Server Time)—Indicates the time and date when the event occurred.
To clear all the System Event Logs, click CLEAR LOG. A message is displayed indicating that the log data cannot be recovered after log
has been cleared.
Monitor hosts on clusters and data centers
The OMIVV enables you to view detailed information about all hosts in a data center or cluster.
View OMIVV data center and cluster information
View overview of data center and cluster
You can view the information such as data center or cluster information, system lockdown mode, hardware resources, and warranty
information. To view the information about this page, ensure that inventory is completed successfully. The OMIVV data center and cluster
views directly report data from iDRAC.
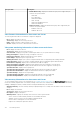
1. On the OMIVV home page, expand Menu, and then select Hosts and Clusters.
Host Management
105