
Users Guide
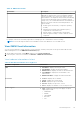

NOTE: When the hosts are managed using the chassis credential profile, the firmware inventory data show few extra
components such as Life Cycle Controller and Software RAID.
You can launch firmware update and configure system lockdown mode wizards from this page.
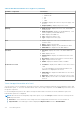
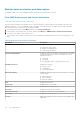
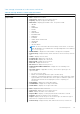
View power monitoring information of a single host
You can view the information such as general information, thresholds, reserve power capacity, and energy statistics.
● General Information—displays the Power Budget and Current Profile name.
● Threshold—displays the Warning and Failure thresholds in watts.
● Reserve Power Capacity—displays the Instant and Peak reserve power capacity in watts.
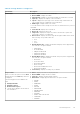
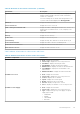
Energy Statistics
● Type—displays the energy statistics type.
● Measurement Start Time (Host Time)—displays the date and time when the host began to consume power.
● Measurement Finish Time (Host Time)—displays the date and time when the host stopped to consume power.
●
NOTE: The host time, as used here, means the local time where the host is located.
Reading—displays the average value of readings over a one-minute time period.
● Peak Time (Host Time)—displays the date and time of the host peak amps.
● Peak Reading—displays the System Peak Power statistic, which is the peak power that is consumed by the system (in
watts).
NOTE: Power monitoring information is not available for hosts with cabled PSU or for modular servers.
NOTE: For hosts managed using chassis, complete power monitoring information is not displayed.
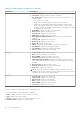
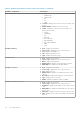
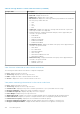
View warranty information of a single host
To view a warranty status, ensure that you run a warranty job. See Schedule warranty retrieval jobs on page 99. The Warranty
Status page enables you to monitor the warranty expiration date. The warranty settings control when server warranty
information is retrieved from Dell online by enabling or disabling the warranty schedule, and then setting the Minimum Days
Threshold alert.
● Provider—displays the name of the provider for the warranty.
● Description—displays a description.
● Start Date—displays the start date of the warranty.
● End Date—displays the end date of the warranty.
● Days Left—displays the days left on the warranty.
● Last Updated—the last time the warranty was updated.
View system event log information of a single host
System event log (SEL) provides status information for hardware that is discovered by OMIVV and displays the following
information:
● Status—There are several status icons such as Informational (blue exclamation point), Warning (yellow triangle with
exclamation point), Error (red X), and Unknown (a box with a ?).
The severity levels are defined as:
○ Info
○ Warning
○ Error
● Time (Server Time)—Indicates the time and date when the event occurred.
To clear all the System Event Logs, click CLEAR LOG. A message is displayed indicating that the log data cannot be recovered
after log has been cleared.
Host Management
115