
Users Guide
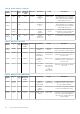
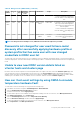
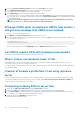
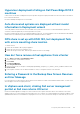

Table 44. Managed nodes (iDRAC/CMC)(continued)
Port
Number
Protocol
s
Port
Type
Maximum
Encryption
Level
Direction Destination Usage Description
To access the iDRAC configurations
from the OMIVV. Used in deployment
flow.
4001 to
4004
NFS UDP None In/Out iDRAC to/from
OMIVV
Public Share
For iDRAC to access NFS public share
that is exposed by OMIVV appliance.
This is used for OS deployment and
firmware update.
To access the iDRAC configurations
from the OMIVV. Used in deployment
flow.
69 TFTP UDP 128-bit In/Out iDRAC to/from
OMIVV
Trivial File
Transfer
Used for managing the iDRAC
successfully from the management
station.
NOTE: For 14th generation PowerEdge servers, iDRAC mounts the NFS through TCP on port 2049.
Password is not changed for user used for bare-metal
discovery after successfully applying hardware profile or
system profile that has same user with new changed
credentials in iDRAC user list
The password of the user used from discovery is not changed to the new credential if only hardware profile or system profile template is
selected for deployment. This is done intentionally so that the plug-in is able to communicate with the iDRAC for future use in deployment
needs.
Unable to view new iDRAC version details listed on
vCenter hosts and clusters page
Resolution: After successful completion of a firmware update task in the vSphere web client, refresh the Firmware Update page and
verify the firmware versions. If the page displays the old versions, go to the Host Compliance page in OpenManage Integration for
VMware vCenter, and check the CSIOR status of that host. If CSIOR is not enabled, enable CSIOR and reboot host. If CSIOR is already
enabled, log in to the iDRAC console, reset iDRAC, wait for few minutes, and then refresh the Firmware Update page.
How can I test event settings by using OMSA to simulate
temperature hardware Fault
To ensure that events are functioning correctly, perform the following steps:
1. In the OMSA user interface, navigate to Alert Management > Platform Events.
2. Select the Enable Platform Event Filter Alerts check box.
3. Scroll down to the bottom, and click Apply Changes.
4. To ensure that a specific event is enabled, such as temperature warning, from the tree on the left, select Main System Chassis.
5. Under Main System Chassis, select Temperatures.
6. Select the Alert Management tab, and select Temperature Probe Warning.
7. Select the Broadcast a Message check box, and select Apply Changes.
8. To cause the temperature warning event, from the tree view on the left, select Main System Chassis.
9. Select Temperatures under Main System Chassis.
Frequently Asked Questions-FAQ
147