
Users Guide

3. In the left pane, select the corresponding chassis IP.
4. Click the Summary tab.
The following information about the selected chassis is displayed:
• Name
• Model
• Firmware version
• Service tag
• IP Address/FQDN
NOTE: If you do not run the inventory job for the chassis, you can see only Service Tag and CMC or Management
Module IP address.
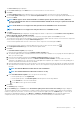
5. View the health status of the devices associated with the selected chassis.
The main pane displays the overall health of a chassis. The valid health indicators are Healthy, Warning, Critical, Not Present. In
the Chassis Health grid view, the health of each component is displayed. The chassis health parameters are applicable for models
VRTX version 1.0 and later, M1000e version 4.4 and later. For M1000e firmware versions less than 4.3, only two health indicators are
displayed, such as Healthy and Warning or Critical (Inverted triangle with an exclamatory mark in orange color).
NOTE: The overall health indicates the health based on the chassis with the least health parameter. For example, if
there are 5 healthy signs and 1 warning sign, the overall health is shown as warning
6. View CMC Enterprise or Express with the license type and expiry date for a chassis.
The mentioned details are not applicable for M1000e and MX chassis.
7. Click the Warranty icon and view the number of remaining days and the days used for a host.
If you have more than one warranty, the last day of the last warranty is considered to calculate the number of days left for warranty.
8. View the errors in the Active Errors table lists for a chassis, which are displayed in the Chassis Health page.
NOTE: For M1000e version 4.3 and earlier, the active errors are not displayed.
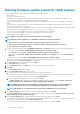
Viewing hardware inventory information for
chassis
You can view information about the hardware inventory within the selected chassis. To view the information in this page, ensure that you
run an inventory job and export a .CSV file with the component information.
1. In the Home page, click vCenter.
2. In the left pane, under OpenManage Integration, click Dell EMC Chassis.
3. In the left pane, select the corresponding chassis IP.
4. Click the Monitor tab.
To view the relevant component information, navigate through OMIVV:
Table 28. Hardware inventory information
Hardware
inventory:
Component
Navigation through OMIVV Information
Fans Use either of the following methods:
• In the Overview tab, click Fans.
• In Monitor tab, expand the left
pane, click Hardware Inventory,
and then click Fans.
Information about fans:
• Name
• Present
• Identifier
• Power State
• Reading (RPM)
• Warning Threshold
• Critical Threshold
○ Minimum
○ Maximum
• Pulse Width Modulation (Only for MX chassis)
100 Chassis management