
Users Guide

About system event logs in web client
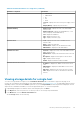
System event log (SEL) provides status information for hardware discovered by OMIVV and displays information based on the following
criteria:
Status There are several status icons: Informational (blue exclamation point), Warning (yellow triangle with exclamation
point), Error (red X), and Unknown (a box with a ?).
Time (Server
Time)
Indicates the time and date when the event occurred.
Search this page Displays the specific message, server names, configuration settings, and so on.
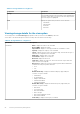
The severity levels are defined as:
Info OMIVV operation completed successfully.
Warning OMIVV operation partially failed, and was partially successful.
Error OMIVV operation failed.
You can save the log as an external CSV file. See Displaying system event logs for an individual host.
Displaying event logs for a single host
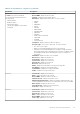
To display the events, perform the following steps:
1. To access the Monitor tab, and open the System Event Log subtab, perform either of the following steps:
Option
Description
From OMIVV Perform the following steps in this option:
a. In OpenManage Integration for VMware vCenter, in the Navigator pane, click Hosts.
b. In the Objects tab, double-click a specific host for which you want to view SEL log.
From the Home page In the Home page, click Hosts and Clusters.
2. In the Monitor tab, select Dell Host Information > System Event Log.
The recent system log entries provide the 10 most recent system event log entries.
3. To update the System Event Log, perform a global refresh.
4. To limit (filter) the number of event log entries, choose one of the following options:
• In the search filter text box, to dynamically filter the log entries, enter a text string.
• To clear the filter text box, click X and all the event log entries are displayed.
5. To clear all event log entries, click Clear Log.
A message is displayed stating that all log entries are deleted after they are cleared and you can select one of the following options:
• To agree to clear log entries, click Clear Log.
• To cancel, click Cancel.
6. To export the event log to a .CSV file, click .
7. To browse to the location and save the system event log, click Save.
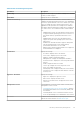
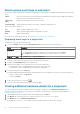
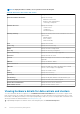
Viewing additional hardware details for a single host
You can view the firmware, power monitoring, warranty status details for a single host on the Dell Hosts Information tab. For
information to appear on this page, run an inventory job. The hardware views directly report the data from OMSA and iDRAC. See
Running chassis inventory job now.
1. In OpenManage Integration for VMware vCenter, in the Navigator pane, click Hosts.
2. In the Objects tab, select the specific host for which you want to view <Component Name> details.
3. In the Monitor tab, select the Dell Host Information tab.
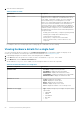
On the Hardware: <Component Name> subtab, view the following information for each of the components:
58
Inventory and warranty management