
Users Guide


* NUMA Enabled and Not Protected: This value indicates that the memory operational mode in BIOS is set to NUMA
FRM, but the operating system does not have support for this feature.
* Disabled: This value indicates that it supports valid systems with any operating system version and here memory
operational mode in BIOS is not set to NUMA FRM.
* Blank: If memory operational mode in BIOS is not supported the NUMA FRM attribute is not displayed.
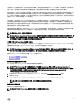
• Recent System Log Entries provide the 10 most recent system event log entries. To launch the System Event Log window
that displays additional log details, click Details.
4.
Under Host Information, click Hardware Inventory to display a list and further details on all components installed in host
system, including:
• Field-replaceable units (FRUs) - DIMMS, system planar, power supplies, backplanes, controller cards, and so on.
• Memory - Number of slots available and in use, maximum capacity and amount of memory in use, and details on individual
DIMMs.
• Network Interface Cards (NICs) - Number of installed cards and details on individual NICs.
• PCI Slots - Total available and number in use, and details on individual slots.
• Power Supplies - Number present and details on individual PSUs.
• Processors - Number present and details on individual CPUs.
• Remote Access Card - IP address information, RAC type, and Web interface URL.
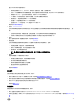
5. Under Host Information, click Storage to display a graphic and detailed view of the capacity and type of physical and virtual
storage, including:
• Host system total storage, uncongured, congured, and global hot spare disk capacity.
• List of how many of each storage component is present in the system.
• Component data table that contains detailed information on that component.
6. Under Host Information, click Firmware to display all Dell Lifecycle Controller rmware information including:
• Update name - BIOS, Dell Lifecycle Controller, power supply, and so on.
• Update type - BIOS, rmware, or application.
• Individual update details - Version, installation time, if an update is in progress or the update status, and the update version.
The update status and version only have data when an update is scheduled, and the update version is the rmware version
to which the system will be updated.
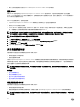
7. Under Host Information, click Power Monitoring to display general power information, energy statistics, and reserve power
information, including:
• Current power budget, prole, warning and failure thresholds.
• Energy consumption, system peak power, and amperage statistics.
• Reserve power and peak reserve capacity.
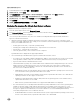
8. Under Host Information, click Warranty to display system warranty information including:
• Warranty provider name and description of the warranty.
• Start and end dates and how many days are left on the warranty.
• Status of the warranty (Active, Expired) and when the warranty information was last updated.
资源清册和许可
如果无法检索和显示服务器数据,可能有几种原因:
• 服务器没有与连接配置文件关联,因此无法完成资源清册任务。
• 未在服务器上运行用于收集数据的资源清册任务,因此没有内容可以显示。
• 已超过主机许可证的数量,必须拥有额外的可用许可证才能完成资源清册任务。
• 服务器没有第 12 代及更高版本服务器所需的正确 iDRAC 许可证,必须购买正确的 iDRAC 许可证。
“立即购买”链接用于首次购买产品,而不是用于升级。仅当使用评估许可证时,才会显示“立即购买”链接。
相关任务:
36